Teach Engineering
Air Pressure
Investigate what is pushing on us. An intriguing lesson has pupils calculate the amount of force on various squares due to air pressure. Using the data, individuals create a graph in the third lesson of the Up, Up and Away unit...
Curated OER
Show Me!
Students analyze and interpret graphs. In this graphing lesson, students view a video and construct their own graphs (line, circle, bar) from given sets of data.
Alabama Learning Exchange
What's Your Favorite Chocolate Bar?
Young scholars complete a math survey. In this math graphs lesson plan, students complete a survey about their favorite candy bars. Young scholars create different kinds of graphs using Microsoft Excel to show their results.
Curated OER
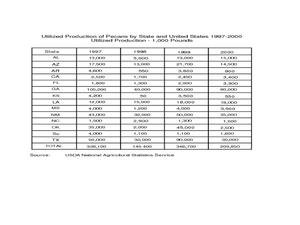
Pecan Power
Students study the origins of pecans and complete a bar graph from the data they have discovered. In this pecan lesson plan, students draw pecans, discuss a pecan time line, and draw a bar graph comparing Arizona pecans to other states.
Curated OER
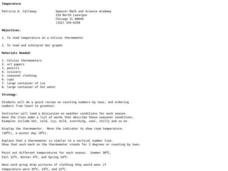
Temperature
Students explore the concept of temperature. In this temperature lesson, students read thermometers in degrees Celsius. Students discuss the temperature of the seasons and what clothing they might wear given a certain temperature....
Curated OER
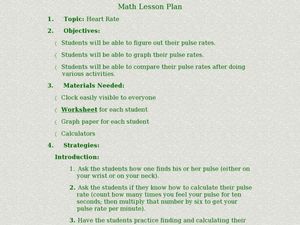
Graphing Heart Rates
Students explore heart rates. They record pulse rates, predict which exercises cause a faster heart rate, make a chart, and graph the results. Students write an essay using the data to support their predictions. They write a hypothesis...
Curated OER
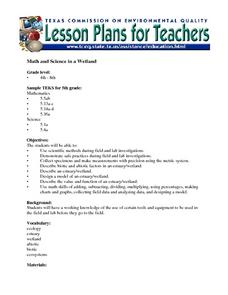
Math and Science in a Wetland
Students describe safe practice when doing field and lab investigations in a estuary or wetland. They create a model of an estuary and describe their value and function. They participate in field study in which they collect and analyze...
Curated OER
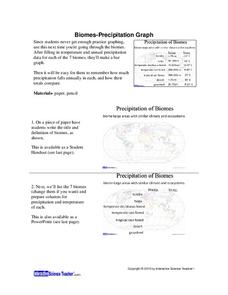
Biomes: Precipitation Graph
Students practice graphing by studying biomes. In this precipitation activity, students graph the precipitation patterns for the 7 biomes on Earth. Students view a PowerPoint presentation in class which explores the 7 biomes and the...
Curated OER
Mathematics In You
Students construct ratios using the hand as data. They use examples of cortical and trabecular bone found in the long bones to measure circumference, diameter, length, and weight of long bones. They perform computations using growth...
Curated OER
Creating a Bar Graph with a Graphing Program
Students use the S'COOL data base to create a bar graph.
Curated OER
Ladybugs in the Garden
Fifth graders estimate the size a population (ecosystems) Students make a chart from information collected then create a graph (line or bar) from this information. Students do a lesson where they observed, examine, and record data...
Curated OER
Bubble Festival
Students practice scientific inquiry while learning about bubbles. In this lesson plan about bubbles, students explore characteristics of bubbles. Students move through nine different "bubble" stations following directions and completing...
Alabama Learning Exchange
Finding Prime
Fifth and sixth graders explore prime numbers. They work with a partner to build rectangular arrays using twelve tiles. Factor pairs are noted and recorded on graph paper. Pupils construct rectangular arrays with a prime number and...
Curated OER
BIG Pumpkins!
How big is the biggest pumpkin you've ever seen? Did it weigh over a ton—literally? Young learners view pictures of some record-breaking pumpkins, including some that weighed over 1,300 pounds, before answering five word problems about...
Curated OER
The Viewing Tube
Looking for an excellent lesson plan that incorporates math, science, and technology? Groups of three students use a viewing tube to perform an experiment, and discover how to organize their data into an Excel spreadsheet. This is a...
Curated OER
Exploration of "Pillbugs"
Fifth graders define vocabulary terms, identify the characteristics of a pillbug, and create a dichotomous key. Then they examine the pillbugs and make observations and record these observations. Finally, 5th graders observe specific...
Curated OER
Mapping the Bone Field: An Area and Scale Exercise
Here is an excellent cross-curricular lesson. Learners relate multiplication to area by making a grid on graph paper, and then creating the same grid in real space outside in the school yard.
Curated OER
A Matter of Fact
Students design their own Science experiment. In this science experiment lesson students create a hypothesis related to matter and test it. They displayed their data in a graph.
Curated OER
Blowing in the Wind
Students compare hurricanes and tornadoes. They write a paragraph explaining how to prepare for a storm. Students give an oral report. They use weather facts to practice math skills. Students record observations of a storm.
Curated OER
So Fast! So Slow!
Fifth graders give examples of objects that move slow and fast. In this physics instructional activity, 5th graders rank animals according to how quickly they move. They create a bar graph of organisms versus rates of speed.
Curated OER
Grid Frame Mapping
Young scholars map and describe small area of the schoolyard and discuss habitats.
Curated OER
Maximize It!
Students design a rectangular box without a lid that has the largest possible volume using the supplied sheet of centimeter graph paper. They work in groups to construct different size boxes to determine the largest possible volume and...
Curated OER
Greenhouse Effect ...Building Our Own
Students explore the greenhouse effect. They set up a simplified model of the earth and the greenhouse effect. Students compare temperatures inside a jar to temperatures outside the jar. Pupils collect information and create a line...
Curated OER
Turn Up the Volume
Measuring volume can be a mystery for 5th graders, but this hands-on activity gives the gift of discovery. The volume of simple rectangular solids and irregular shapes are calculated through various methods including displacing liquid in...


