Illustrative Mathematics
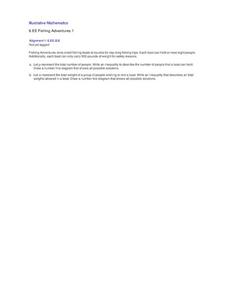
Fishing Adventures 1
Often inequalities exist in many real-world contexts but young math learners struggle with understanding how to represent that relationship in a simple equation using an inequality. This activity focuses on the basic concepts by using...
Curated OER
Choose a Graph to Display Data
In this math graphs worksheet, students write line plot, tally chart, pictograph, or bar graph to tell the best kind of graph to use to answer the six questions.
Curated OER
Graphing Names in Historic Cemetery
Students collect information from headstones about names of the deceased in their local community. They determine the most common names and graph them. They discuss their findings with the class.
Curated OER
M&M Graphing and Probability
Learners sort, classify, and graph M & M's. They create pictographs and bar graphs with the colors and numbers in each bag of M & M's. They calculate the ratio and probability based on class results.
Curated OER
Functions and Graphing
Graphing functions in a real world application makes math come to life. Learners graph points on a coordinate plane and identify various points on a graph by working through a set of real world problems. This is a perfect review exercise.
Curated OER
Survey Says...
Young statisticians collect, organize, and present data to illustrate responses to a survey question. They write and conduct the survey. They finish by presenting the results in the form of a graph.
Curated OER
Graphing
Fifth graders practice using math graphs. For this graphing lesson, 5th graders work in groups to develop a topic of their own to represent as a graph. Students collect data and construct a graph for the lesson.
Jude Mphoweh
Coordinates
This coordinate graphing lesson gives your young graphers practice graphing points on these rectangular coordinate grids.
Exploratorium
Traveling Networks
Show your class the path to understanding graph theory. Scholars learn about basic graph theory using an activity based on the Bridges of Konigberg problem. They draw networks on the playground and decide whether it is possible to travel...
Noyce Foundation
Granny’s Balloon Trip
Take flight with a fun activity focused on graphing data on a coordinate plane. As learners study the data for Granny's hot-air balloon trip, including the time of day and the distance of the balloon from the ground, they practice...
Curated OER
Easter Bar Graph - (E)
In this math review worksheet, students complete addition, multiplication, division, and subtraction problems where each answer is put into an Easter bar graph. Students complete 13 problems.
Curated OER
Easter Bar Graph - (B)
In this math review instructional activity, students complete addition, subtraction, multiplication, and division problems and put their answers into a bar graph that represents calories. Students complete 13 problems and 1 graph.
Curated OER
Easter Bar Graph - C
In this math review worksheet, students complete addition, multiplication, division, and subtraction problems where each answer is inserted into a bar graph. Students complete 13 problems.
Curated OER
Easter Bar Graph - (D)
In this math review learning exercise, students complete addition, multiplication, division, and subtraction problems where each answer is put into an Easter bar graph. Students complete 13 problems.
Curated OER
What on Earth is Greater Than?
Students compare things that are greater than, less than, or equal to, compare the Earth to other planets, and list planets from greatest size to smallest size.
Curated OER
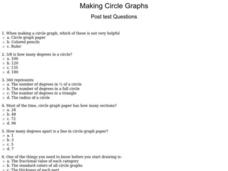
Making Circle Graphs
In this circle graphs worksheet, students answer multiple choice questions about how to make circle graphs. Students answer 10 questions total.
Curated OER
Using Circle Graphs
In this circle graphs activity, students read a story about buying craft materials. Kids examine the circle graph that shows how much spent on each type of material. Students then solve 3 problems using the data shown.
Curated OER
Problem Solving: Use a Graph: Problem Solving
In this bar graph worksheet, students read the word problem and use the bar graph to complete the problem solving questions for understand, plan, solve, and look back.
Curated OER
What's Your Average? What Do You Mean? I'm More Than Just Average
Upper grade and middle schoolers collect data, analyze and interpret the data. This three-part lesson should provide learners with a firm understanding about the differences between mean, median, and mode and how to perform the...
Curated OER
Interpreting Graphs: Temperate Climates
In this interpreting graphs worksheet, students read a graph containing data of rainfall and temperature, then complete 18 questions, interpreting the data.
Curated OER
Graphs and Spreadsheets
Students collect data and present it in a graph and/or a spreadsheet, depending on their previous understanding of technology.
Pennsylvania Department of Education
Use Order of Operations to Evaluate Expressions—No Grouping Symbols
Students identify and explain different types of data collection and graphs. In this graphs and data collection lesson, students record their observations of a variety of data collection tools and graphs displayed in the room. Students...
Pennsylvania Department of Education
Equal Groups
Students explore statistics by completing a graphing activity. In this data analysis instructional activity, students define a list of mathematical vocabulary terms before unpacking a box of raisins. Students utilize the raisins to plot...
Wisconsin Online Resource Center
Oversized Inch
Each member of the class creates their own paper ruler. Using their ruler, kids walk around the room measuring the objects you've specified. Discuss how items should be measured to the 16th of an inch, the smallest unit on their ruler....
Other popular searches
- Inequalities Graphing
- Math Graphing Inequalities
- Inequalities and Graphing
- Algebra Graphing Inequalities


