Scholastic
Study Jams! Mean/Average
Join Zoe as she calculates the average number of points RJ scored in his basketball games. This step-by-step presentation clearly models the procedure for finding the mean of a data set, including examples with both whole number and...
Curated OER
Pick A Number
Elementary schoolers find out which month has the most class birthdays (mode) and which birthday represents the middle point of all the birthdays (median). They gather and organize data to find one number that fairly represents the whole...
Beacon Learning Center
Line Plots
Introduce line plots, show examples of tables, graphing on a number line, and engage in a class discussion. Share the process by which statistical data is organized and displayed on a number line. Examples and worksheets are included....
Curated OER
Explore Surface Types on a Journey Around Earth
Young scholars explore satellite data. In this technology cross-curriculum math and world geography lesson, students locate specific map areas using a microset of satellite data. Young scholars use technology and math skills to determine...
Curated OER
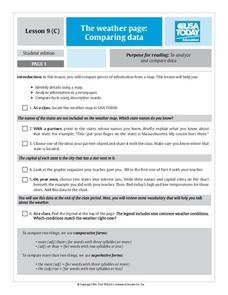
The Weather Page: Comparing Data
Students analyze data from maps. For this comparing data lesson, students use comparative and superlative statements to draw comparisons among the weather in different American cities based on USA Today weather maps.
Curated OER
Statistics and Shopping
Explore how statistics are used in everyday life. Your soon-to-be savvy consumers use the Internet to find consumer-related statistical information and learn to make wise consumer decisions. Includes links to a practice sheet about data...
Education Development Center
Geography of the Coordinate Plane
Put the graph into graphing and allow learners to understand the concept of point plotting and how it relates to data. The worksheet provides a nice way to connect data analysis to a graph and make predictions. The worksheets within the...
Curated OER
Coordinates
For beginning point plotters, these graphs give a good introduction. They examine a graph with shapes drawn onto it and each vertex labeled. There are 20 total, and scholars write the coordinates of each labeled point. All of these are...
Curated OER
Coordinate Graphs
As you introduce coordinate graphs to scholars, be sure to use guided worksheets like this one. Using an example for guidance, they write the coordinates of five points on a graph, each distinguished as a shape symbol. Next, scholars do...
Curated OER
Range, Mode, and Median
Fifth and sixth graders sort data from least to greatest and mark an X on the line plot to show how many of each number. Then they determine the range, mode, and median for the problem.
Curated OER
Data Collection - Primary Poster
Students explore the concept of collecting, analyzing, and graphing data. In this collecting, analyzing, and graphing data lesson, students create a survey about a topic of interest. Students poll their classmates, analyze, and graph...
Curated OER
Plotting Data on a Graph
Students investigate graphing. In this graphing lesson, students survey the class and create graphs to reflect the data collected.
Curated OER
Rescue Mission Game
Young scholars conduct probability experiments. In this rescue mission instructional activity, sudents play a game and collect statistical data. They organize and interpret the data and determine the probability of success. Students...
Curated OER
How Does Water Cool?
How fast does water cool? First fifth graders will draw a line on a graph that predicts how fast they think water can cool from boiling. Then they plot the actual data on the same graph to see if their estimate was correct.
Curated OER
Interpreting Line Graphs
Fifth graders interpret line graphs. In this graphing instructional activity, 5th graders first begin by reviewing the difference in bar and line graphs and what they are used for. Students practice interpreting the data on various line...
Noyce Foundation
Granny’s Balloon Trip
Take flight with a fun activity focused on graphing data on a coordinate plane. As learners study the data for Granny's hot-air balloon trip, including the time of day and the distance of the balloon from the ground, they practice...
Curated OER
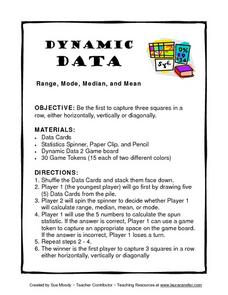
Dynamic Data Range, Mode, Median, and Mean
In this lesson plan, Dynamic Data Range, Mode, Median, and Mean, students play a game while figuring range, mode, median, and mean. Students spin for their task, figure the mode, mean, median or range of a row of numbers and gain a space...
Curated OER
Data-gathering Activities Relating to Trees in Their Environment
Students gather data relating to trees in their environment. In this biology lesson plan, students determine heights of trees and their ages. A canopy map will indicate optimal growing areas for the tree.
California Education Partners
Science Fair Project
Plant the data firmly on the graph. Given information about the growth rate of plants, pupils determine the heights at specific times and graph the data. Using the information, scholars determine whether a statement is true and support...
Curated OER
Let's Plot Points
Use coordinate grid paper to plot points and identify shapes that are already plotted on the paper by saying their coordinates. Pupils also measure the distance between points and play the game Battleship. There are several web links and...
PBS
Working with Coordinate Planes: Assessments
It's time for scholars to show what they know about coordinate planes with a collection of three assessments. The exams' objectives include plotting points on a single grid, measuring using the distance formula, and identifying points on...
Curated OER
Explore: Collect And Organize Data
In this exploring how to collect and organize data worksheet, students, working with a partner, problem solve the answers to seven word problems involving data.
Curated OER
Give Me A Break!
Students create and conduct a survey. In this broken bones lesson, students discuss if they've ever broken a bone and how a broken bone heals. Students generate questions for a survey on broken bones and healing time, conduct the survey...
Scholastic
Study Jams! Double-Line Graphs
With two summers of babysitting money, Mia needs a way to compare her earning from both years. Show your learners that they can organize the data onto a double-line graph to easily compare which summer was more profitable. The lesson...


