Curated OER
Monster Data
An inventive lesson shows learners how to collect, organize, and present mathematical data. They access websites which lead them through a variety of ways to engage in data collection. They get to design and create graphs, and present...
Curated OER
Collecting Data and Graphing
Young mathematicians collect data and graph it. They work collaboratively to collect data regarding the span of arm length versus height and graph the data they collect.
Curated OER
Data and Probability: What is the Best Snack?
In this math/nutrition instructional activity, the nutritional value of 3 snack foods is recorded on a data chart and represented on a bar graph. Young scholars analyze and compare information, construct data charts and related bar...
Earth Watch Institute
Entering Local Groundhog Data in an Excel Spreadsheet
Here is a cross-curricular ecology and technology lesson plan; your learners create spreadsheets depicting the location and number of groundhog dens in a local park. They research groundhogs and analyze data about where the groundhog...
Sea World
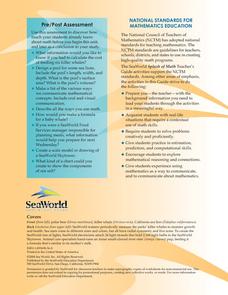
Splash of Math
How can kids use math to learn about marine life? Combine math skills with science lessons in a resource featuring activities about life in the sea. Kids graph and calculate data, solve complex word problems, measure geometric shapes,...
National Security Agency
Line Plots: Frogs in Flight
Have a hopping good time teaching your class how to collect and graph data with this fun activity-based instructional activity series. Using the provided data taken from a frog jumping contest, children first work together creating a...
Curated OER
Probability
Here is a classic activity used to introduce your class to the concept of probability and data collection. They will roll one die 30 times, then record and discuss the results. Great introduction, but too shallow to be considered a...
Curated OER
Excel Lesson
Young scholars explore data and Excel spreadsheets. They collect data about political candidates. Students enter the data into a chart on Excel. They create a graph using the data and Excel.
Curated OER
Rescue Mission Game
Students conduct probability experiments. For this rescue mission lesson, sudents play a game and collect statistical data. They organize and interpret the data and determine the probability of success. Students plot points on a...
American Statistical Association
Candy Judging
Determine the class favorite. The statistics lesson plan has pupils collect, display, and analyze data. Pairs rank four kinds of candy based on their individual preferences. Working as an entire class, learners determine a way to display...
Curated OER
Data Collection - Primary Poster
Students explore the concept of collecting, analyzing, and graphing data. In this collecting, analyzing, and graphing data lesson, students create a survey about a topic of interest. Students poll their classmates, analyze, and graph...
Curated OER
Applied Science - Science and Math Lab 4B
Learners experiment with the combination of vinegar and baking soda. In this applied science instructional activity, future scientists compare qualitative and quantitative data collected from their exploration. Then they work together to...
Curated OER
The Write Stuff
Fourth graders share a previously written portfolio piece and the class guesses the genre. Students use tally marks to keep track of how many of each piece there are in class. Once the data collection is complete, 4th graders create a...
Curated OER
Mathematics and Environmental Concerns
Learners gather data and analyze behaviors regarding recycling. In this environmental concerns unit, students discus and examine reuse, recycle, and reduce. Learners collect, graph, and display data associated with four lessons in the...
Curated OER
Creating a Graph
Students brainstorm favorite things to do during the summer. They survey classmates to collect data, arrange it in a chart, and create graphs using ClarisWorks.
Curated OER
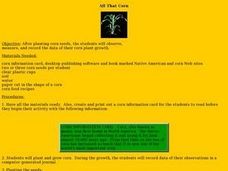
All That Corn
Students observe and record data. For this plant growth lesson, students plant and grow corn. Students observe the growth of their corn and record their data. Students read corn recipes and select their favorite four recipes to write...
Curated OER
Data-gathering Activities Relating to Trees in Their Environment
Learners gather data relating to trees in their environment. In this biology lesson plan, students determine heights of trees and their ages. A canopy map will indicate optimal growing areas for the tree.
Pennsylvania Department of Education
Use Order of Operations to Evaluate Expressions—No Grouping Symbols
Students identify and explain different types of data collection and graphs. In this graphs and data collection lesson, students record their observations of a variety of data collection tools and graphs displayed in the room. Students...
Curated OER
Pizza, Pizza
Young scholars survey community members to determine their favorite pizza toppings and create a bar graph to show their findings. In this probability and statistics instructional activity, students collect data by conducting a survey....
Curated OER
Boomerang
Students explore the concept of boomerangs. In this boomerang lesson, students throw homemade boomerangs at different angles to record maximum distance and if it returned or not. Students collect their boomerang data then create a...
American Institutes for Research
Digital Smiles
Explore metric measurement, recording data, and creating an electronic spreadsheet displaying results with your math class. Scholars will measure the length of their smiles, record the measurements, and represent the results on an...
Curated OER
Chances Are
Upper graders examine the concept of probability. They collect data and create a bar graph. They must interpret the data as well. Everyone engages in hands-on games and activities which lead them to predict possible outcomes for a...
National Security Agency
Are You Ready to Call the Guinness Book of Records?
Learners design questions that can be answered by collecting data. In this line-plot activity, pupils collect data and graph on a line plot on world records. An abundant supply of teacher support is provided in this resource.
Curated OER
All in the Family
Students use data to make a tally chart and a line plot. They find the maximum, minimum, range, median, and mode of the data. Following the video portion of the lesson, students will visit a Web site to test their data collection skills...


