Curated OER
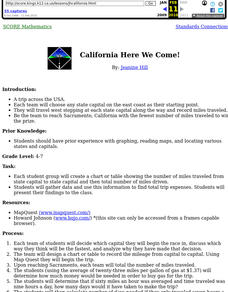
California Here We Come!
A highly relevant and great cross-curricular project! In teams, your class will plot a course from the East Coast to Sacramento, California passing through all of the state capital cities along the way. As part of the journey, teams will...
Curated OER
What's Your Favorite Planet?
Fourth graders interpret a graph and make correlations using data. After taking a class survey, 4th graders create a class graph of their favorite planets. Working in small groups, they interpret the information and create at least ten...
Curated OER
The Bigger they Are . . .
Young scholars do a variety of data analyses of real-life basketball statistics from the NBA. They chart and graph rebounding, scoring, shot blocking and steals data which are gathered from the newspaper sports section.
Curated OER
The Winner Is...
Learners create graph from previously collected data using "The Graph Club."
Curated OER
Patterns Everywhere!
Learners recognize and demonstrate the patterning of numbers and objects in our environment. They create a pattern using geometric shapes and find a missing number in a sequence.
Curated OER
Tally Time
Students create a tally chart. In this math and health lesson plan, students discuss healthy foods and create a tally chart showing the number of students who like to eat healthy foods.
Curated OER
Use Google Maps to Teach Math
Capture the engagement of young mathematicians with this upper-elementary math lesson on measuring time and distance. Using Google Maps, students first measure and compare the distance and time it takes to travel between different...
NOAA
Sustaining Our Ocean Resources
Lead young scientists on an investigation of fishery practices with the final installment of this four-part unit. Using a PowerPoint presentation and hands-on simulation, this instructional activity engages children in learning how fish...
Curated OER
Jelly Bean's Galore
Students investigate the origins of the Jelly Bean. They complete a Scavenger Hunt using the jellybean website. Pupils create a bar graph using information collected about jelly beans. Students discuss the time of year that Jelly Beans...
Curated OER
Mapping the Ocean Floor
Students construct and interpret a line graph of ocean floor depth and a bar graph comparing the height/depth of several well-known natural and man-made objects and places. In addition, they calculate the depth of two points using sonar...
Curated OER
The Coyote Population: Kansas Prairies
Students discover animal lifestyles by researching their ecosystem. In this animal statistics lesson, students research the geography of Kansas and discuss the reasons why wild animals survive in the open Kansas fields. Students complete...
Curated OER
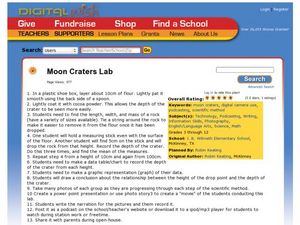
Moon Craters Lab
Young scholars explore characteristics of mass. In this scientific inquiry about mass lesson plan, students drop rocks of different weights from various heights and record the depth of the "crater" created. Young scholars record their...
Curated OER
Harry Potter Research Project
Students work together to complete a research project on Harry Potter. They write a research question and develop a survey to give to their classmates. Using the results, they create a graph and draw conclusions about the data collected.
Curated OER
Skittles Lab
Students use Skittles as manipulatives to practice computing decimals from fractions, computing decimals into percentages, and creating bar graphs from gathered data.
Curated OER
Food Groups in our Lunch
Learners make a graph. In this food groups and graphing instructional activity, students pack a sack lunch and then work in groups to tally the number of foods from each food group that they have. Learners use the data collected to...
Curated OER
The Great Pollinators
Students discover the reproductive parts of a plant. In this biology lesson, students identify and categorize several different plants they dissect in class. Students record their information using a data chart.
Curated OER
Checking County Numbers
Students use their county's information page to gather information about their community. Using the information, they create graphs from the tables provided and interpret the data. They write a paragraph showing their interpretation of...
Curated OER
Measuring the Speed of a Wave
Students create an experiment in which they measure the speed of a wave and record the data in a graph. They work in small groups to write the procedure for the experiment and share it with another group for cross checking of the...
Curated OER
Fly Away With Averages
Young scholars study mean, median, and mode. They construct paper airplanes and test them to see how far they fly. They measure the distance and then find the averages of their throws. They use spreadsheet software to record the data...
Curated OER
Inventors Unit Survey
Students develop and conduct a survey for their inventors unit. They create a five question survey and tally the survey results, and create a graph using Microsoft Word and Graph Club 2.0.
Curated OER
Locating the Salt Front
Students use Hudson River salinity data to create a line
graph that shows the location of the salt front, and use math
skills to explore how this location varies over time. They use the graph to estimate the location of the salt front...
Curated OER
Finding the Salt Front
Young scholars discuss definitions of estuary, salinity, and the salt front. They listen as the teacher explains the Hudson River Miles and ways the upriver and downriver sections relate to the north and south. Students graph the salt...
Curated OER
Cinderbank
Fourth graders identify major components of a "Cinderella" story in order to create a database.
Curated OER
Be Sharp and Never Flat
An outstanding lesson on music awaits your young composers! They learn about patterns found in music, the different sections of an orchestra, and see the differences between musicians and a composer. Excellent streamed videos and good...


