Utah Education Network (UEN)
The Human Line Plot
Learners collect data and use charts and line plots to graph the data. Some excellent worksheets and activities are embedded in this fine lesson on line plots.
Scholastic
Study Jams! Line Plots
Data analysts are guided through the arrangement of whole-number data onto a line plot by listening and viewing a high-quality, animated, and narrated set of slides.
Curated OER
Custom Line Plot Worksheets
Do you need to create custom line plot worksheets for your math learners? Use this template to create the line plot. Include up to five questions below the plot.
National Security Agency
Line Plots: Frogs in Flight
Have a hopping good time teaching your class how to collect and graph data with this fun activity-based lesson series. Using the provided data taken from a frog jumping contest, children first work together creating a line plot of the...
National Security Agency
Are You Ready to Call the Guinness Book of Records?
Learners design questions that can be answered by collecting data. In this line-plot lesson, pupils collect data and graph on a line plot on world records. An abundant supply of teacher support is provided in this resource.
Curated OER
Flicking Football Fun
Young mathematicians fold and flick their way to a deeper understanding of statistics with a fun, hands-on math unit. Over the course of four lessons, students use paper footballs to generate data as they learn how to create line...
PBS
Button, Button
Youngsters count, classify, and estimate quantities using buttons after a read aloud of The Button Box by Margarette S. Reid. They discuss the difference between guessing and estimating. Based on an experiment, they predict the number of...
Curated OER
All in the Family
Students use data to make a tally chart and a line plot. They find the maximum, minimum, range, median, and mode of the data. Following the video portion of the lesson, students will visit a Web site to test their data collection skills...
National Security Agency
Line Graphs: Gone Graphing
Practice graphing and interpreting data on line graphs with 36 pages of math activities. With rationale, worksheets, and assessment suggestions, the resource is a great addition to any graphing unit.
West Contra Costa Unified School District
Decimals and Fractions
Reinforce the concept of fractions and decimals as part of a whole with a instructional activity that begins with a mixed review, then goes into a three problem guided practice, and ends with a collaborative activity. The guided practice...
Curated OER
Button Bonanza
Collections of data represented in stem and leaf plots are organized by young statisticians as they embark some math engaging activities.
Curated OER
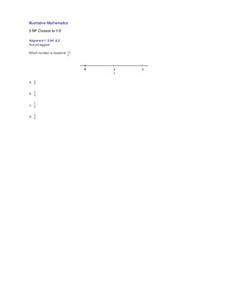
Closest to 1/2
Using a number line, pupils are asked to identify which of four fractions is closest to one half. Includes a single problem that can serve as a practice problem or formative assessment for 3rd or 4th graders learning to partition number...
Curated OER
M&Ms; Line Plots and Graphing
Young scholars, using small individual bags of M&Ms, engage in activities including; estimating, sorting, graphing, mean, median, mode, fractions, percentage, and averaging.
California Academy of Science
California's Climate
The United States is a large country with many different climates. Graph and analyze temperature and rainfall data for Sacramento and Washington DC as you teach your class about the characteristics of Mediterranean climates. Discuss the...
Curated OER
RCX Car Line Graph
Students develop a line graph based on distances that an RCX car drives in specified amounts of time. They then are given a specific amount of time for the car to drive and be asked to extrapolate the car's distance from the graph.
Scholastic
Study Jams! Choosing the Correct Graph
With so many types of graphs, don't let your learners get stuck figuring out which one to use. To track how Zoe spent her allowance, use this interactive lesson to review all the types of graphs and pick the best one to display the data....
Curated OER
Coordinates on a Shower Curtain: Math
Students use a shower curtain to represent a coordinate plane and then physically demonstrate their understanding or ordered pairs as they move from place to place.
Curated OER
Take a Chance on Probability
Connect ratios, probability, and combination outcomes with a challenging activity idea. It guides your learners through probability of an event as fractions or ratios, on a number line, and with correct vocabulary. The class will be...
Common Core Sheets
Determining Coordinates: Graphing Patterns
Building on their prior knowledge about patterns, this series of worksheets introduces young mathematicians to graphing in the coordinate plane. Using written descriptions of different numerical patterns, learners create sets of order...
Curated OER
Go The Distance Car Construction
Students build and program a car to drive a specific challenge distance.They must at the end of the lesson, have the car that stops the closest to a challenge distance.
Curated OER
Learn How to Graph
Students examine various types of charts and discover how to construct a line graph. Using graph paper, they construct a graph displaying weight loss over a five-year period. They draw copnclusions from the completed graphs.
Curated OER
Family Activity: Bar Graphs and Line Graphs
For this math worksheet, students work at home with a family member on a graphing activity. Students count the number of cans, glass jars, boxes and bags in the pantry. Students make a bar and a line graph to represent the data.
Curated OER
Jon and Charlie's Run
Let's use math to solve an argument. Jon and Charlie are debating about who can run farther, but who is right? That's what your class will figure out as they apply their understanding of fractions to this real-life situation. A simple,...
Curated OER
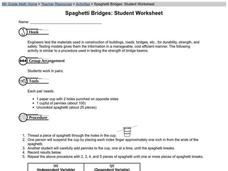
Spaghetti Bridges: Student Worksheet
Pairs of learners work together in order to simulate how engineers test materials for strength and safety in the real world. They use paper cups and pieces of spaghetti to run strength tests. This excellent worksheet should lead to...


