Curated OER
Interpreting Circle Graphs
What does this pie chart mean? Once scholars can analyze a circle graph on a basic level (i.e. "Most people prefer cats"), it's time to delve deeper into it. They examine two graphs here, and are given the total number of participants...
Curated OER
Bar Graphs
Introduce scholars to bar graphs and data analysis through analyzing these visual examples. First, they look at a pictograph of fruit types and answer five observation questions. There is one done for them as an example. Learners do the...
Curated OER
Picture Graphs
An innovative way to practice reading data, as well as the four operations! Three picture graphs prompt first graders to count marbles, books, and pets. They also solve addition and subtraction problems. Additionally, they work on...
Curated OER
Simple Tally Charts and Bar Graphs
Introduce your first graders to the world of tally marks, bar graphs, and the organization of data. Pupils determine a favorite ice cream flavor based on tally marks, then use a bar graph to answer some questions about sports. There are...
Curated OER
Graphs
For beginners to picture graphs this is the perfect resource. They analyze two bar graphs that break down data visually so scholars can actually count the number in each column. For the first, they fill in how many of each type of pet is...
Curated OER
Line Graphs
Let's take a look at Luis' bike ride! Scholars examine a line graph charting a 20-kilometer bike ride over the course of six hours. They answer six questions about the data requiring the understand the concepts of each axis and the line...
Curated OER
Reading Graphs
Encourage kids to read line graphs with confidence using these examples and accompanying comprehension questions. Learners examine two graphs and answer four questions about each. This is definitely intended for beginners to this type of...
Illustrative Mathematics
Weather Graph Data
Teaching young mathematicians about collecting and analyzing data allows for a variety of fun and engaging activities. Here, children observe the weather every day for a month, recording their observations in the form of a bar graph....
Curated OER
Read My Bar Graph!
Elementary schoolers make and use bar graphs to picture information. They learn how choosing the right scale for a bar graph can help make a persuasive argument. This is a terrific lesson on graphing which should excite your kids. There...
Curated OER
Build a Bar Graph
Learners discover how to use bar graphs. They will gather and organize specific data in order to put it into a bar graph. Then they will answer several questions based on the information they have graphed.
Curated OER
Chocolate Graphing
Chocolate lovers develop a bar graph based on the types of chocolate the class likes. They participate in The Art of Chocolate at The Hershey Story before they make a bar graph that shows the favorite chocolate types of their class. They...
Curated OER
Graphs that Represent Data Sets
These four scenarios all contain graphable data; can scholars match them to the correct bar graphs? All the data is in single-digit whole numbers. Some of the scenarios instruct kids to make a graph, while others don't. Clarify...
Baylor College
Global Atmospheric Change: The Math Link
Change up the classroom atmosphere with this interdisciplinary resource. Following along with the children's book Mr. Slaptail's Curious Contraption, these math worksheets provide practice with a wide range of topics including simple...
Curated OER
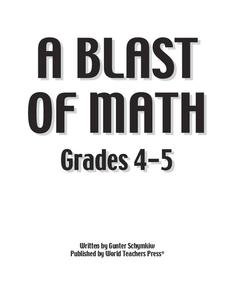
A Blast of Math
In this metric measurement worksheet, students solve 20 fill in the blank questions related to metric measurement, converting metric units, area of rectangles, picture graphs, patterns, geometric shapes. Students then convert 9...
Google
Graphing with Google Docs & Forms
Get to know your class and teach about data analysis all with the help of Google Docs. Using student-generated questions, create a class survey using Google Forms. Reserve time in the computer lab for learners to complete the form and,...
Curated OER
Graphing Ordered Pairs
Are you working on graphing ordered pairs in your class? For this worksheet, learners, after looking over and studying how to graph ordered pairs, plot points on a coordinate grid and connect the dots. Class members also identify what...
Curated OER
Easter Graphing Fun
Graphing can be festive! This Easter worksheet has scholars using coordinates to record the location of ten holiday images. The first is done for them, and the grid is large and appealing to younger learners. Consider visualizing this...
Royal Baloo
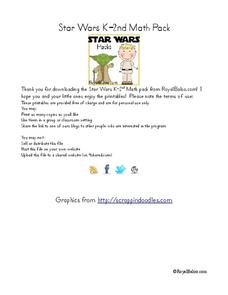
Star Wars K-2nd Math Pack
Included in a Star Wars themed packet, young padawans enhance mathematical skills such as graphing, computing using basic operations, counting numbers and money, telling time, and measuring. Scholars play a game of sudoku, read number...
Curated OER
Math: Navigating the World Around Me
Young mathematicians research and discuss real world math word problems and ways in which they apply math concepts in their everyday lives. They create a storyboard of a math word problem from which they create a slide for a multi-media...
National Security Agency
Line Graphs: Gone Graphing
Practice graphing and interpreting data on line graphs with 36 pages of math activities. With rationale, worksheets, and assessment suggestions, the resource is a great addition to any graphing unit.
Heidi Songs
Zoo Animal Probability Graph
Capture the engagement of your young mathematicians with a collaborative graphing activity. Using a deck of zoo animal picture cards, students select a picture from the deck, record the chosen animal on a graph, and then replace the card...
Mixing In Math
Mixing in Math: Growing Plants
Whether you have your class plant seeds or begin when sprouts are visible, math skills are used here to predict and track growth over time. Straw bar graphs show plant height on a given day while the graph as a whole shows changes over...
Teachers Network
A World of Symmetry: Math-Geometry
Define and identify the three basic forms of symmetry translation, rotation, and glides with your class. They cut out and arrange paper pattern blocks to illustrate symmetry, create a Cartesian graph, and design a rug with a symmetrical...
Scholastic
Study Jams! Circle Graph
Over a pizza dinner, RJ and Mia discuss how to use a circle or pie graph to represent data. After viewing, data analysts can use a Test Yourself feature to assess their own understanding. This is ideal for use in a flipped classroom lesson.
Other popular searches
- Charts and Graphs Math
- Hidden Picture Math Graphs
- Misleading Graphs Math
- Powerpoint Math Graphs
- 1st Grade Math Graphs
- Math Graphs 4th Grade
- Math Reading Graphs
- Animals Math Graphs
- Math Graphs Grade 1
- Creating Math Graphs
- Math Graphs Using M&ms
- Math Interpreting Graphs


