Curated OER
Introduction to Bar Graphs Lesson Plan
Learners organize and interpret data using bar graphs.
National Security Agency
Are You Ready to Call the Guinness Book of Records?
Learners design questions that can be answered by collecting data. In this line-plot lesson, pupils collect data and graph on a line plot on world records. An abundant supply of teacher support is provided in this resource.
Curated OER
Usage and Interpretation of Graphs
Students review graphing and use processing skills to solve problems.
Curated OER
Dealing With Data
Students collect, organize, and display data using a bar graph, line graph, pie graph, or picture graph. They write a summary describing the data represented and compare the graph to another graph in the class.
Curated OER
Graphing
Students investigate graphing. In this bar graph lesson plan, students view an informational website about graphing, then construct a class birthday bar graph outside with sidewalk chalk. Students choose a survey topic, then collect...
Curated OER
When Ants Fly
Here is a great lesson on constructing line graphs. Learners identify common characteristics of birds, ants common needs of all living things. They also write a story from the perspective of an ant or a bird that has lost its home and...
Curated OER
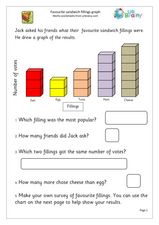
Simple Graph Activity
In this graphing activity, students interpret a simple bar graph of favorite sandwiches, answering 5 related questions and then conducting their own survey and creating a graph of the results.
Curated OER
Chances Are
Upper graders examine the concept of probability. They collect data and create a bar graph. They must interpret the data as well. Everyone engages in hands-on games and activities which lead them to predict possible outcomes for a...
Curated OER
My Test Book: Reading Graphs
In this online interactive math skills learning exercise, students solve 10 multiple choice math problems that require them to read and interpret graphs. Students may view the correct answers.
Curated OER
Jim, Tony, and Frank - The School Fundraiser
In this bar graph worksheet, students use the horizontal bar graph to count how much money each student collected for their fundraiser. Students answer 10 questions.
Curated OER
The Bread Shop
In this bar graphs worksheet, students study the bar graph to count the money Adam made during each day. Students answer 10 questions.
Curated OER
Tim and Pat - At the Store
In this bar graphs worksheet, students use the bar graph to add how much time Tim and Pat spend buying candy each week. Students complete the table and answer 3 questions.
Curated OER
Jim, Tony and Frank - The School Fundraiser
In this bar graphs learning exercise, students use the bar graph to count how much money kids collected during a weekend fundraiser. Students answer 10 questions.
Curated OER
Tony's Spelling Troubles
Students are introduced to the given problem and describe in their own words the situation represented in a bar chart and tally chart. They then use a bar chart and tally chart to make sensible predictions.
Curated OER
E3 Practice Assessment - Pets
In this assessment instructional activity, 3rd graders complete eight pages of math assessment. Students solve problems related to money and a bar graph. Students solve word problems involving rounding and computation.
Curated OER
Graphing Favorite Holidays
Students create spreadsheets and bar graphs based on results of survey of favorite holidays.
Curated OER
Twelve Days of Christmas--Prediction, Estimation, Addition, Table and Chart
Scholars explore graphing. They will listen to and sing "The Twelve Days of Christmas" and estimate how many gifts were mentioned in the song. Then complete a data chart representing each gift given in the song. They also construct...
Curated OER
Graphing Favorite Fruit
Third graders take poll and sort data, enter the data to create a spreadsheet and create bar and pie graphs.
Curated OER
Data Display
Learners explore different ways to display data. In this statistics lesson, students create pie charts, bar graphs and line graphs to show data. Learners then write a paragraph discussing which types of graphs are helpful for different...
Curated OER
C is for Cookie-A MEAN-ingful Graphing Activity
Third graders, in groups, dissect a variety of brands of chocolate chip cookies and calculate the mean for each brand. They create their own bar graphs, pictographs, and line graphs to represent information.
Curated OER
Button Bonanza
Collections of data represented in stem and leaf plots are organized by young statisticians as they embark some math engaging activities.
Curated OER
Graphing Fun In Third Grade
Third graders display information in a graph, table, and chart. In this data lesson plan, 3rd graders look at graphs, tables, and charts, discuss their importance, and make their own.
Curated OER
Getting Graphs: Researching Genealogy-A Piece of Pie
Third graders research their genealogy. In this math lesson, 3rd graders collect data and create graphs and charts. A presentation of their findings is given.
Curated OER
Mathematics Within: Bar And Pie Graphs
Students compare and contrast the use of bar and pie graphs with the same data. They create a data set by surveying all students in the class using sticky notes to make a table on the board. Then, each student creates a bar and pie graph...


