Curated OER
Data and Probability: What is the Best Snack?
In this math/nutrition lesson, the nutritional value of 3 snack foods is recorded on a data chart and represented on a bar graph. Students analyze and compare information, construct data charts and related bar graphs, and draw...
Curated OER
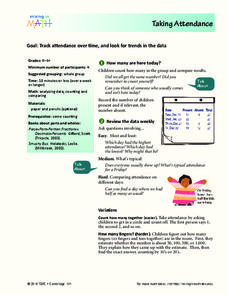
Taking Attendance
Young mathematicians record and analyze data. They will take attendance for their class and compare to other days. Then discuss ways to count who is present. They may also show the amount of students present using fractions.
Curated OER
Mystery Jars
This is a twist on the old "guess how many jellybeans" game. Using estimation and math skills, learners participate in a fun "mystery jars" activity, trying to make educated guesses at how many objects are in two jars. The basic activity...
Curated OER
Pictographs
What do these pictographs show? Scholars analyze three sets of data organized into pictographs, filling in several comprehension questions about each. The first one is done for them as an example, but consider going over it together to...
DK Publishing
Using Information in Tables
Find out how well can your second or third graders use tables to solve word problems by assigning this single-page worksheet. Two tables with different sets of data prompt learners to solve six problems. An example at the top of the page...
Curated OER
Building Brilliant Bar Graphs
Everything you need for a mini-unit on bar graphs is included in this lesson plan! It outlines three lessons and includes worksheets. Learners taste pretzels, shoot baskets (switching off hands), and grab candy, graphing results...
Curated OER
Unit 5: Order Whole Numbers in the 100s and 1,000s
There are three quick number ordering activities here for your mathematicians. First, they analyze data on the number of three types of pies sold. Scholars choose from four ordered lists the one showing fewest to most sold. Then, they...
Pennsylvania Department of Education
Multiplication Represented as Arrays
Third graders collect data about themselves and use in a line plot. In this analyzing data activity, 3rd graders collect various sets of information,create a line plot and compare the data. Students complete a worksheet on their results.
Computer Science Unplugged
Lightest and Heaviest—Sorting Algorithms
How do computers sort data lists? Using eight unknown weights and a balance scale, groups determine the order of the weights from lightest to heaviest. A second worksheet provides the groups with other methods to order the weights. The...
Curated OER
State Data
Young scholars select ten states and use the number of letters in each state name as their data. In this measures of central tendency lesson, students find the mean, median and mode of the number of letters in their selected state names....
Curated OER
Place Value of Whole Numbers Through One Million
Third graders construct numbers to the millions place. In this 30-page place value instructional activity, learners create numbers and evaluate the place value of digits. They explore standard and expanded form of numbers. An incredible...
Curated OER
Reflection on Educational Goal Setting and Self-Assessment
Third graders evaluate their performance at school. They examine their most recent spelling test scores to determine whether or not they met their goals for the test.
Curated OER
Ramp Builder
Learners plan and build a ramp designed for maximum distance a car can travel. In this physics and data collection math lesson plan, students work in groups to design a ramp using various household materials. Learners test small cars on...
Discovery Education
Mood Music!
Grouchy? Sad? Here's a great resource that shows kids how music can be used to lift their spirits. Kids collect and chart data on the effects of music on emotions. After analyzing the results of their experiment, they develop their own...
Curated OER
Misleading Graphs
Students explore number relationships by participating in a data collection activity. In this statistics lesson, students participate in a role-play activitiy in which they own a scrap material storefront that must replenish its stock....
Curated OER
Give Me a Minute
Pupils categorize data. In this categories lesson plan, students get a specific topic and they have a minute to list as many items that fit under this topic. They compare lists with a classmate and discuss whether all answers work.
University of Kansas
Newspaper in the Classroom
Newspapers aren't only for reading—they're for learning skills, too! A journalism unit provides three lessons each for primary, intermediate, and secondary grades. Lessons include objectives, materials, vocabulary, and procedure, and...
Curated OER
Eat Your Veggies
Students investigate displaying data. In this displaying data lesson, students use tallies to count data about food preferences. Students use various types of graphs such as bar graphs, picture graphs, box-and-whisker plots, etc to...
Curated OER
M & Ms in a Bag
Learners make predictions about the number and colors of M&M's in a snack size package. They create an Excel spreadsheet to record the data from their small group's bag, create a graph of the data, and discuss the variations of data...
Curated OER
Smoking: The Real Cost
Third graders discuss the adverse effects of smoking and predict the financial cost of a smoking habit. They collect data regarding the cost of a pack of cigarettes and average packs smoked a day. They create bar graphs displaying the...
Curated OER
Awesome Animals
Students collect data from classmates about their favorite animal. They use the ClarisWorks graphing program to enter data, graph results, and interpret data.
Curated OER
Measuring to the Nearest Inch
Third graders use whole numbers and fractions to make connections between abstractions of the mathematical world and the real world. In this fractions and measurement lesson, 3rd graders identify, quantify groups , and measure distances....
Curated OER
1, 2, 3 Hooray for Number Equivalency!
Students represent equivalent amounts using concrete materials, number symbols, and number words.
Alabama Learning Exchange
How Old is Your Money?
Elementary learners explore coin mint dates. First, they listen to the book Alexander Who Used to be Rich Last Sunday by Judith Viorst. They then sort a collection of coins according to their mint date and put them in order from oldest...


