Curated OER
Graph Groups
In this graphing worksheet, 3rd graders create their own bar graphs. students study the pictures shown and complete 5 graphs beside each picture.
Curated OER
Who's Hiding in Mike's Math Club Picture?
Learners use coordinates to complete the picture. They complete seven groups of coordinates and connect the dots to create an image.
Mathed Up!
Pictograms
Young mathematicians read, interpret, and complete a variety of real-world pictograms. Each question includes a key and information to complete the graphs.
Curated OER
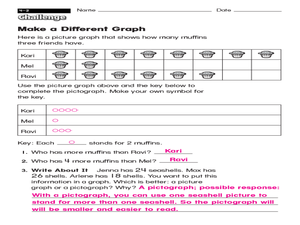
Make a Different Graph
What is the difference between a picture graph and a pictograph? Young learners are given a picture graph detailing how many muffins three friends have, and they must complete a pictograph using a symbol of their choice. An answer key is...
Curated OER
Smarties Pictogram and Bar Chart
For this math worksheet, students create a bar chart to illustrate the number of Smarties they have in each color. Students also draw a pictogram to represent the same information.
Public Schools of North Carolina
Math Stars: A Problem-Solving Newsletter Grade 3
Make sure your class stays up with the times using this series of math newsletters. Including word problems that cover topics ranging from consumer math and symmetry to graphing and probability, these worksheets are a fun way to...
Public Schools of North Carolina
Math Stars: A Problem-Solving Newsletter Grade 2
Develop the problem solving skills of your young learners with this collection of math newsletters. Covering a variety of topics ranging from simple arithmetic and number sense to symmetry and graphing, these worksheets offer a nice...
California Education Partners
Colorful Data
Scale up your lessons with a performance task. Young data analysts work through an assessment task on scaled bar graphs. They answer questions about a given scaled bar graph on favorite colors, analyze a bar graph to see if it matches...
Curated OER
Use a Graph Reteach 4.8
In this graph activity, students solve 3 problems using a data table and bar graph. Students write number sentences to figure out answers to the questions about kinds of toys in a shop.
Curated OER
Graphing Farm Animals
In this graphing worksheet, students use the pictures of the animals to in the graph to determine how many farm animals are in the graph. Students draw the farm animals that match the numbers. Students then complete farm animal pattern...
Curated OER
Part of a Whole Group One
In this fractions learning exercise, students solve word problems where they solve problems about parts of whole groups using pictures, charts, and more. Students complete 4 problems.
Curated OER
Graphing Ordered Pairs
For this math worksheet, students learn to graph ordered pairs. Students examine a graph with 3 labeled points and tell the ordered pairs for each. Students also plot 8 ordered pairs on a graph they draw themselves.
Curated OER
5th Grade Math: Probability
In this probability learning exercise, 5th graders complete multiple choice questions about probability by looking at and answering questions about different types of graphs. Students complete 19 questions.
Curated OER
Shaquille O'Neal Hand & Foot Span
If Shaquille O'Neal wears a size-20 shoe, how big are his hands? Learners will use the average ratios of foot length to hand span to calculate the hand span of Shaq, but first, they have to collect the data! They will measure their peers...
Curated OER
Boots
In this graphing practice instructional activity, 5th graders plot squares on a graph with an x and y axis. Once students locate each square they must color a certain design in that box to create a larger picture.
Curated OER
The Square Counting Shortcut
An excellent lesson that encourages students to discover how complex figures can be broken into simpler shapes when measuring area. Working with block letters, learners are given the freedom to develop their own strategies for...
Curated OER
Pictures of Data
In this data worksheet, students look at maps and charts and answer multiple choice questions about them. Students complete 10 questions.
Living Rainforest
Finding the Rainforests
From Brazil to Indonesia, young scientists investigate the geography and climate of the world's tropical rain forests with this collection of worksheets.
Illustrative Mathematics
Half of a Recipe
Kids love to cook! What is a better place to learn mixed numbers than with a recipe? It is up to learners to decide how they want to divide this recipe in half. They may choose to model the mixed number and then divide the model by two....
Illustrative Mathematics
How Many _______ Are In. . . ?
Help your learners gain meaningful understanding of dividing fractions using fraction models. The activity includes nine problems which are sequenced to show how the fraction division algorithm evolves. Have students use graph paper or...
Education.com
Measure School Supplies
Ever wonder how long a pair of scissors are? Find out with this simple measuring activity in which pupils use the provided ruler to determine the length of four common classroom supplies.
Curated OER
Organizing Data
In this tally chart activity, learners complete a tally chart of the number of each animal they see in the picture and answer short answer questions about it. Students complete the chart for 5 animals and answer 3 questions.
Worksheet Web
Using Pictographs
If one ice cream cone represents three ice cream scoops, and Bob has four ice cream cones, then how many scoops does Bob have? Learners solve these kind of questions with their new understanding of pictographs.
Math Stars
Math Stars: A Problem-Solving Newsletter Grade 6
Think, question, brainstorm, and make your way through a newsletter full of puzzles and word problems. The resource includes 10 different newsletters, all with interesting problems, to give class members an out-of-the box math experience.
Other popular searches
- Coordinate Picture Graphs
- Christmas Picture Graphs
- M&m Picture Graphs
- Hidden Picture Math Graphs
- Picture Graphs Worksheets
- Math Lessons Picture Graphs
- 5th Grade Picture Graphs
- Bar and Picture Graphs
- Thanksgiving Picture Graphs
- Circle and Picture Graphs
- Picture Graphs Template
- Reading Picture Graphs


