Curated OER
Graphing
Students collect data to create different types of graphs-line, pie, and bar graphs. They use StarOffice 6.0 to create graphs.
Math Moves U
Collecting and Working with Data
Add to your collection of math resources with this extensive series of data analysis worksheets. Whether your teaching how to use frequency tables and tally charts to collect and organize data, or introducing young mathematicians to pie...
US Department of Commerce
Featured Activity: Population Change Over Time
Keep track of a state's population. After a brief discussion on how population data is used for funding, individuals look at population changes over time. Pupils find the population of two states using three different censuses. They then...
Math Learning Center
Fourth Grade Assessments and Scoring Checklists, Common Core State Standards
Find out how your class is progressing in math with a set of assessments. Learners finish a baseline assignment to assess where they are beginning the year and then work on tests with increasing difficulty as the year progresses.
Curated OER
Data and Probability: What is the Best Snack?
In this math/nutrition instructional activity, the nutritional value of 3 snack foods is recorded on a data chart and represented on a bar graph. Young scholars analyze and compare information, construct data charts and related bar...
Curated OER
Applied Science - Science and Math Lab
Students make a prediction. In this applied science lesson plan, students guess the number of items in a jar. Students create a bar graph to show the predictions and the actual amounts.
Curated OER
Pies and Percentages--Learning About Pie Graphs
In this pie graph worksheet, students draw a pie graph for the zookeeper with the data he collected, choose a different color for each animal species and make a key to the graph.
Curated OER
Graphing with Stems-and -Leafs
Fourth graders examine the use of stem and leaf graphs. In this stem and leaf graph activity, 4th graders participate in teacher led activity showing the use of the graphs. They work in groups to collect data about peanuts before making...
Curated OER
Sunshine Math-1
In this math skills activity, students answer 7 questions in which they use various basic math skills. They use number lines, charts, number blocks, a calendar and a ruler to complete this activity.
Curated OER
Using Graphs and Charts
Students complete T charts and manipulate numbers using graphs and charts. In this math graphs and charts lesson, students review the concepts of pattern and function. Students then complete practice pages where they manipulate numbers...
Curated OER
Graphing Using Cookies
Students differentiate between bar graphs, line graphs, pictographs and bar graphs. After participating in a hands-on cookie activity, students label and draw their own graphs.
Curated OER
Organizing Data Using Tables and Graphs
Young scholars create graphs and tables, as well as interpret and make inferences from the data shown to determine when and where graphs and tables are most useful.
Curated OER
Apple Graph
Students sample three types of apples. They choose their favorite apple. They create a graph, charting the favorite apples of their classmates. They answer a series of questions.
Curated OER
Have You Looked Outside? Lesson #5- Graphing Weather Conditions
First graders study daily weather changes. For this weather and graphing lesson, 1st graders chart the daily weather for a month using stickers or weather symbols. They graph the weekly weather so that at the end of the month students...
Curated OER
Creating Graphs from Tables
Students interpret data from tables and then create a graph to show the same data in a different organization.
Curated OER
Data Display
Students explore different ways to display data. In this statistics lesson, students create pie charts, bar graphs and line graphs to show data. Students then write a paragraph discussing which types of graphs are helpful for different...
Curated OER
Learn How to Graph
Young scholars examine various types of charts and discover how to construct a line graph. Using graph paper, they construct a graph displaying weight loss over a five-year period. They draw copnclusions from the completed graphs.
Alabama Learning Exchange
Wheels All Around
Budding mathematicians explore the concept of skip counting. They practice skip counting as they use it to determine the number of wheels that come to school at 3 different times throughout the day. They also create a data graph to show...
Curated OER
Physical Science: Festival of Bubbles
Investigate bubbles through the use of scientific inquiry. Pupils blow bubbles using several methods and measure the resulting bubble print. Measurements are recorded on a data table and transferred to a bar graph. Results are discussed...
Beacon Learning Center
Line Plots
Introduce line plots, show examples of tables, graphing on a number line, and engage in a class discussion. Share the process by which statistical data is organized and displayed on a number line. Examples and worksheets are included....
Curated OER
Level III: Technology Integration
Fourth graders prepare two spreadsheets each with an embedded line graph that displays data about the growth of the bitter rot fungus on apples and on petri dishes that were stored in the refrigerator and the classroom. They prepare a...
Curated OER
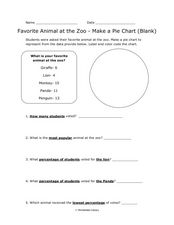
Pie Chart: Favorite Animal at the Zoo
In these three interpreting a pie chart and answering questions worksheets, learners use the data provided to label and color code the blank and outlined pie charts, read and interpret a completed pie chart, and then answer questions...
Curated OER
Graphing
Students investigate graphing. In this bar graph lesson, students view an informational website about graphing, then construct a class birthday bar graph outside with sidewalk chalk. Students choose a survey topic, then collect data and...
ARKive
Handling Data: African Animal Maths
Handling and processing data is a big part of what real scientists do. Provide a way for your learners to explore graphs and data related to the animals that live on the African savannah. They begin their analysis by discussing what they...


