Hi, what do you want to do?
Sophia Learning
Sophia: Histogram Tutorial
Explore how to organize and display data in a histogram through this tutorial.
Sophia Learning
Sophia: Independent Variable
The concept of independent variable is described in this video tutorial. The lesson provides detailed examples.
Sophia Learning
Sophia: Interpreting Data Using Histograms
Explore how to interpret data from a histogram.
Sophia Learning
Sophia: Measures of Variation
Use data sets to determine the measures of variation. Check understanding with a quiz.
Sophia Learning
Sophia: Median Tutorial
Place data in numerical order to determine the median. Assessment to follow to determine understanding.
Sophia Learning
Sophia: Pie Charts
Explore how data is represented on a pie chart and how to interpret the data. Take a quiz to assess learning.
Sophia Learning
Sophia: Representing Data With Pie Charts
Explore how to use data to create a pie chart and take a quiz to assess learning.
Sophia Learning
Sophia: Sample Space
This video lesson defines and provides examples of sample space. Students can check their understanding with an assessment.
Sophia Learning
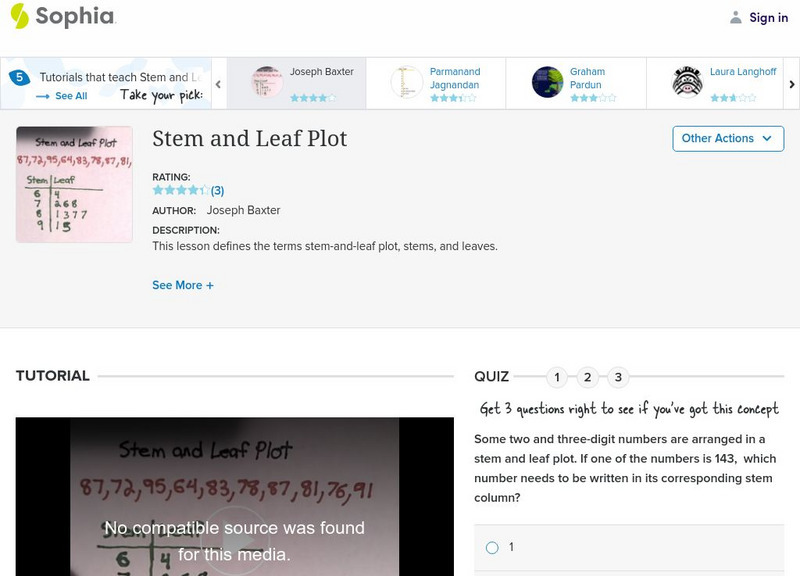
Sophia: Stem and Leaf Plot
Look at the frequency of numbers in the data set using a stem and leaf plot. Check understanding with a quiz.
Sophia Learning
Sophia: Supporting Details: Statistics
A lesson with audio discussing how analogies can be used as supporting details. [4:00]
Sophia Learning
Sophia: The Usefulness of Stem and Leaf Plots
This lesson explains why stem-and-leaf plots are useful when representing data. Students can watch a video tutorial to learn the concept.
Sophia Learning
Sophia: Understanding Mean Tutorial
Explore how to find the mean, the average, of given data. Take a quiz to assess understanding.
Sophia Learning
Sophia: Why Collect Data Tutorial
Discover the importance of collecting data through this tutorial.
Sophia Learning
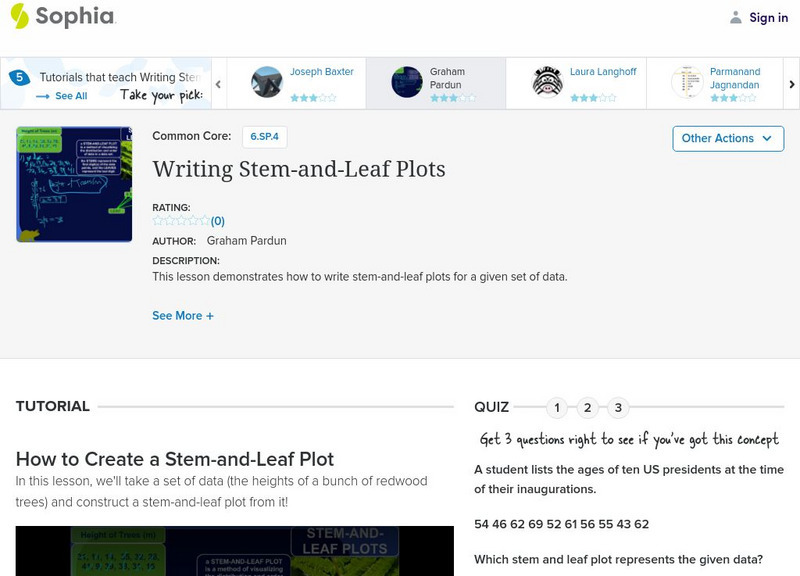
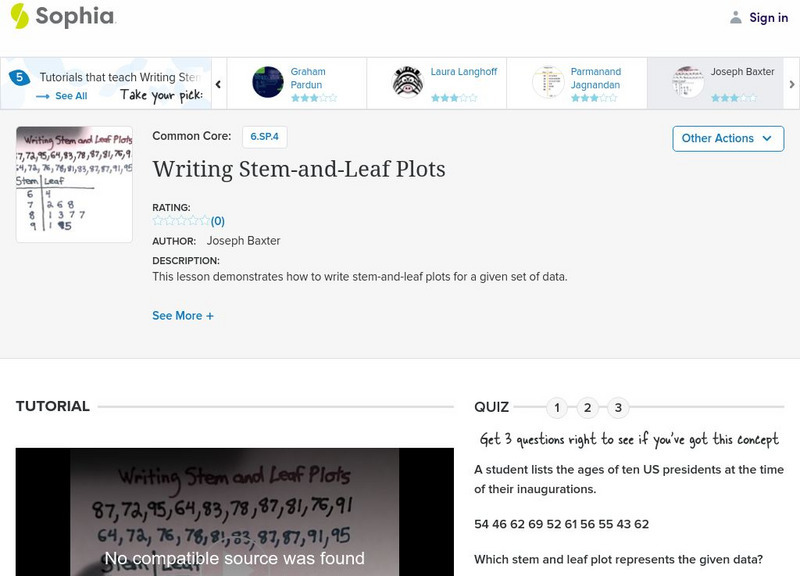
Sophia: Writing Stem and Leaf Plots
Use data sets to write stem-and-leaf plots. Check understanding with a quiz.
Sophia Learning
Sophia: Writing Stem and Leaf Plots
Write a stem-and-leaf plot from a given set of data and assess learning with a quiz.
Imagine Learning Classroom
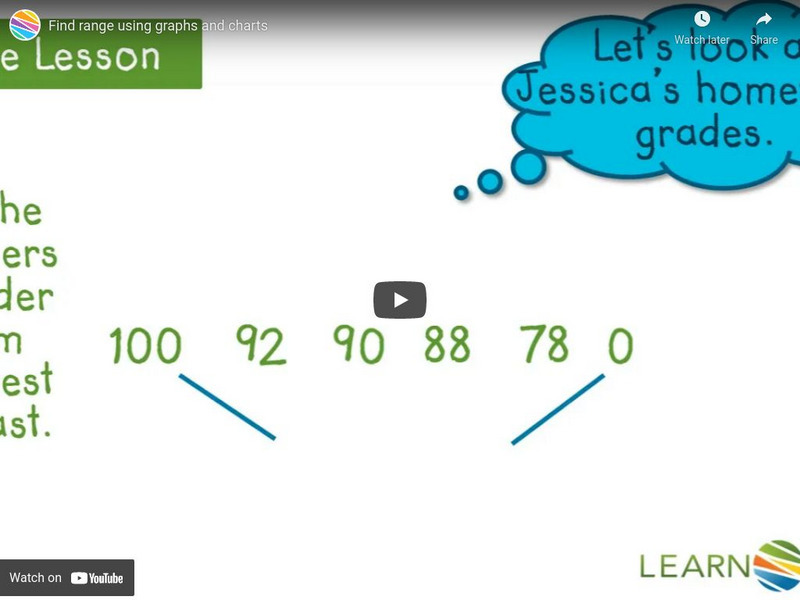
Learn Zillion: Find Range Using Graphs and Charts
In this lesson, you will learn to find the range of a given set of data including and excluding the outlier by using graphs and charts. Login gives access to a slideshow as well. [5:07]
Imagine Learning Classroom
Learn Zillion: Use and Find the Range of a Data Set
In this lesson, you will learn how to describe the distribution of data by using the range. [4:30]
Sophia Learning
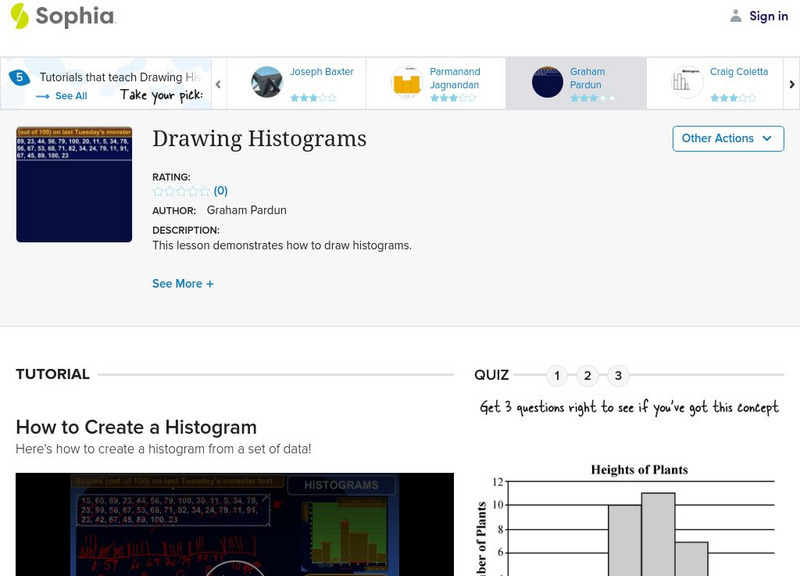
Sophia: Drawing Histograms
Given a data set, explore how to create a histogram. Complete quiz to assess understanding. [9:42]
Virtual Nerd
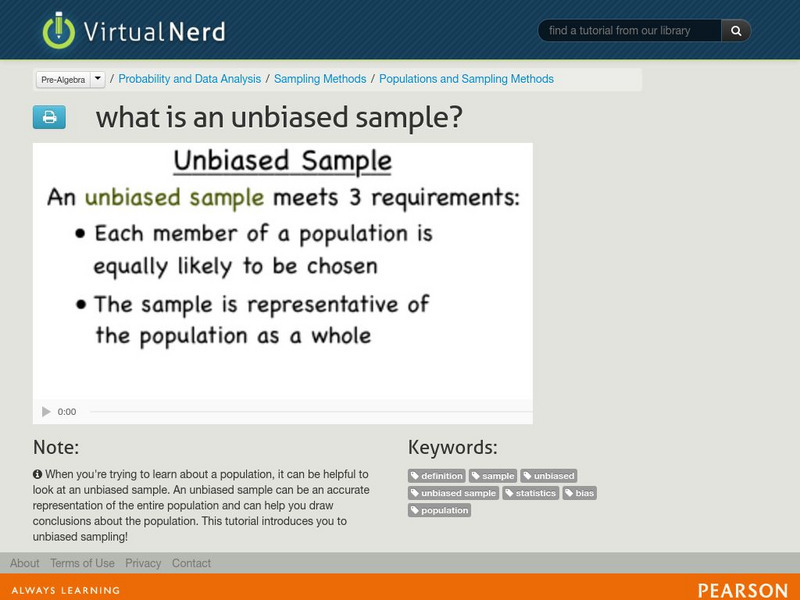
Virtual Nerd: What Is an Unbiased Sample?
This tutorial introduces you to unbiased sampling which can be helpful when trying to learn about a population. [5:04]
Virtual Nerd
Virtual Nerd: What Is Bivariate Data?
Bivariate data is data that has two variables. Take a look at this tutorial to discover facts about bivariate date. [4:45]
Imagine Learning Classroom
Learn Zillion: Video: 'Model a Data Set With a Normal Probability Distribution'
In this lesson, you will learn how to model a data set with a normal probability distribution by using the mean and standard deviation of the data set. [4:59]
Crash Course
Crash Course Statistics #1: What Is Statistics?
In this series we take a look at the important role statistics plays in our everyday lives. Statistics help us better understand the world and make decisions from what you'll wear tomorrow to government policy. But in the wrong hands,...
Virtual Nerd
Virtual Nerd: How Do You Use a Line Graph to Make Predictions?
Watch this tutorial to see how can you use a line graph to make predictions about the future. [3:37]
PatrickJMT
Patrick Jmt: Box and Whisker Plot
Easy to understand video tutorial explores how to make a box and whisker plot. [5:53]


