Curated by
ACT
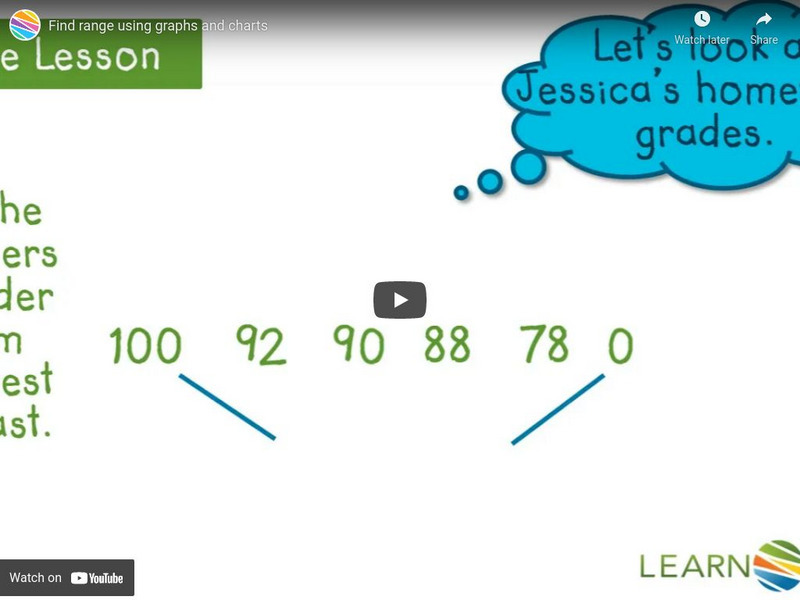
In this lesson, you will learn to find the range of a given set of data including and excluding the outlier by using graphs and charts. Login gives access to a slideshow as well. [5:07]
3 Views
2 Downloads
CCSS:
Adaptable
Concepts
Additional Tags
Classroom Considerations
- Knovation Readability Score: 3 (1 low difficulty, 5 high difficulty)
- The intended use for this resource is Instructional
- This video is hosted on YouTube
