Bloomberg
Ex-RBI Governor Rajan Sees Emerging Markets as a Global Risk
Aug.23 -- Raghuram Rajan, professor at the University of Chicago Booth School of Business and former Reserve Bank of India governor, discusses the economic risks facing the global economy with Bloomberg's Kathleen Hays at the Federal...
Flipped Math
Comparing Distributions
Here's a lesson that is beyond compare. Young mathematicians learn to compare data distributions in the fourth of five installments in Algebra 1 Unit 4. They consider the shape of the distributions, identify any outliers, and compare the...
Crash Course
Regression: Crash Course Statistics #32
Regression models help make sense of statistical data and assist people in making predictions describing the world around us. A thorough video lesson discusses linear regression models and concepts related to the models, such as...
Anywhere Math
Measures of Variation
Variation makes the world—and data sets—more interesting. Young data analysts view an engaging YouTube video to learn about measures of variation. Range and interquartile range are the topics under consideration here.
Crash Course
Plots, Outliers, and Justin Timberlake - Data Visualization Part 2: Crash Course Statistics #6
How many ways can you visualize data? An informative video showcases data representations, with specific attention to stem-and-leaf plots and box plots. Viewers also learn to identify and interpret outliers in data.
PBS
Real-Life Math | Baseball
The math in baseball is more than just batting averages. The Assistant General Manager of the Diamondbacks shows the numerous ways the management uses baseball math. The class participates in an activity to simulate batting averages and...
National Education Association
Using Measures of Central Tendency
Is it better to be average or an outlier? It all depends on your perspective! The video explains the impact an outlier has on central tendency. Using multiple examples to solve for mean, median, and mode, the video proves that having an...
Curated OER
What is the Median of a Data Set?
Mean, mode, median? What's the difference? How do you find them? The teacher focuses on explaining median in this video. She gives a good explanation and shows several examples using different sets of numbers.
Curated OER
What is the Median of a Data Set?
Mean, mode, median? What's the difference? How do you find them? The teacher focuses on explaining median in this video. She gives a good explanation and shows several examples using different sets of numbers.
Texas Education Agency
Texas Gateway: The Median Median Line and Least Absolute Value Line
This lesson explains how to use the median-median line to fit a line to data when there are outliers away from the general pattern. Includes downloadable study guide with exercises - guide also covers other topics. [18:59]
Sophia Learning
Sophia: The Effects of Outliers on Centers of Measure
Explore the effects of outliers on mean, median, and mode.
Sophia Learning
Sophia: Box and Whisker Plots
Box-and-whisker plots are explored in this tutorial. The lesson provides a PowerPoint presentation that defines the terms involved and a video lesson that demonstrates how to create a box-and-whisker plot.
Sophia Learning
Sophia: Finding the Mean of a Set of Data
This video lesson demonstrates how to find the mean of a data set. It includes detailed examples about when it is appropriate to find the mean.
Sophia Learning
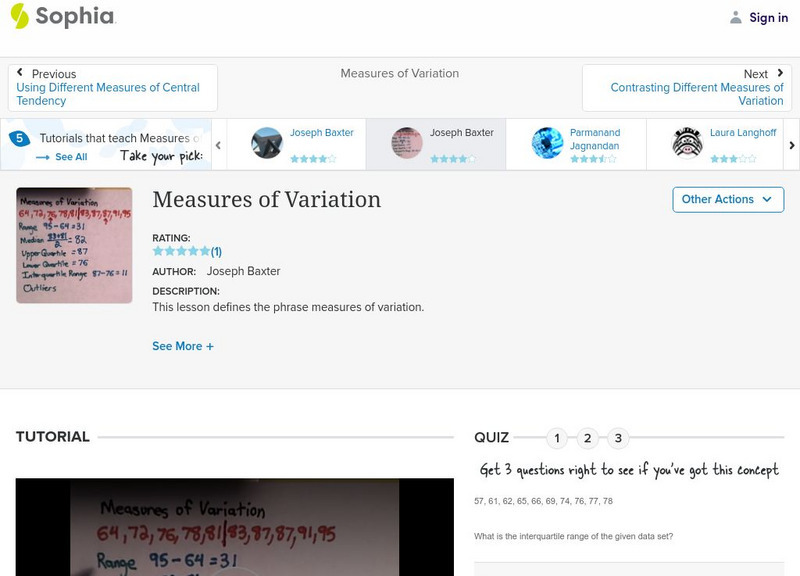
Sophia: Measures of Variation
Use data sets to determine the measures of variation. Check understanding with a quiz.
Imagine Learning Classroom
Learn Zillion: Lesson Video for 'Understand the Effect of Outliers on Shape'
In this lesson, you will learn how outliers affect shape and measures of center and spread by comparing their impact to what you already know about the effect of skewness. [7:20]
Study Pug
Study Pug: Influencing Factors in Data Dollection
The process of data collection for research can be prone to errors. For example, biased and misleading survey questions, and leading survey questions can all affect the results greatly. In this lesson, you will learn how to identify and...
Sophia Learning
Sophia: Extreme and Mild Outliers
This lesson discusses how mild and extreme outliers are represented on a box plot.
Sophia Learning
Sophia: Extreme and Mild Outliers: Lesson 3
This lesson discusses how mild and extreme outliers are represented on a box plot. This is part of a series of lessons about the parts of a box plot. It is 3 of 3 in the series titled "Extreme and Mild Outliers."
Sophia Learning
Sophia: Interpreting Box and Whisker Plots
This video lesson demonstrates how to interpret box-and-whisker plots to find outliers.
Study Pug
Study Pug: Influencing Factors in Data Collection
The results of researches are heavily affected by the process of data collection. However, the process is prone to errors. For example, biased and misleading survey questions, and leading survey questions can all affect the results...


