Hi, what do you want to do?
New Mexico State University
Ratey the Math Cat
Find a perfect way to recognize rates. The class first watches a video that emphasizes the word per when referencing a rate. Pupils then use their knowledge to create their own rates via station activities. Finally, individuals use...
Mathispower4u
Graph a Direct Variation Equation (Negative Slope) Example 2
Bypass the table and go straight to the graph. A short video shows one example of graphing a direct variation equation with a negative slope by using the same method as graphing an equation in slope-intercept form. Pupils see it's easy...
Mathispower4u
Graph a Direct Variation Equation (Positive Slope) Example 1
Show classes a quick method to graphing. A short video demonstrates how to graph a direct variation equation by comparing it to graphing an equation in slope-intercept form. By seeing the y-intercept is 0, scholars easily plot the slope...
FuseSchool
Finding the Gradient of a Straight Line
Investigate the relationship between the gradient, or slope, of a line and its graph. Pupils learn to use a graph to calculate the slope of a line. The video lesson includes both positive and negative slopes and compares the steepness of...
Krista King Math
Slope
Examine the features of linear slope with a video tutorial that explains the origin of the slope formula using a graph. Pupils then see several examples including positive, negative, and slopes of varying steepness.
Krista King Math
Direct Variation
Viewers examine the properties of direct variation equations and use them to problem solve. The instructor describes the concept of direct variation and then applies the formula to a word problem. She shows the relationship between the...
Government of Alberta
Learn alberta.ca: Math Interactives: Rate/ratio/proportion (Video Interactive)
The use of rate, ratio, and proportion is illustrated in this video about action photography. An additional interactive element allows students to explore equivalent ratios equivalencies through enlarging and reducing images to compare...
Khan Academy
Khan Academy: Algebra: Proportionality Constant for Direct Variation
This video demonstrates how to set up an equation for direct variation and solve for the variable "k" which represents the constant of proportionality. [1:44]
Khan Academy
Khan Academy: Algebra: Direct Variation Application
This video demonstrates how to solve a word problem involving a direct variation. It shows how to set up a linear equation for a directly proportional relationship and solve for the constant of proportionality. [2:02]
Math Mammoth
Math Mammoth: Unit Rates and More About Proportions
Explains what a unit rate is, how to calculate it, and how it relates to slope. [11:38]
Math Mammoth
Math Mammoth: Scaling Figures and the Scale Ratio
Explains what a scale ratio between two figures means and how to use it to calculate unknown side lengths. [8:31]
Virtual Nerd
Virtual Nerd: How Do You Find the Rate of Change Between Two Points on a Graph?
Check out this tutorial to practice finding the rate of change using a graph. [4:51]
Khan Academy
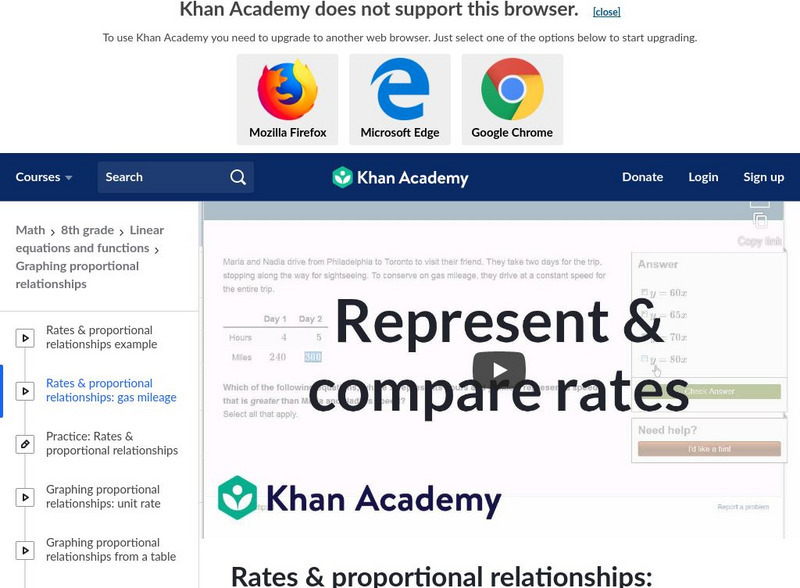
Khan Academy: Rates & Proportional Relationships: Gas Mileage
Video explores rates and proportional relationships using a gas mileage problem. [3:18]
Khan Academy
Khan Academy: Graphing Proportional Relationships: Unit Rate
Video tutorial demonstrates how to graph the equation of a line that represents a proportional relationship given a unit rate. [4:30]
Khan Academy
Khan Academy: Graphing Proportional Relationships From a Table
Explore how to graph the equation of a line that represents a proportional relationship given a table. [1:10]
Khan Academy
Khan Academy: Graphing Proportional Relationships From an Equation
Video lesson shows how to graph the equation of a line that represents a proportional relationship given an equation. [3:08]
Virtual Nerd
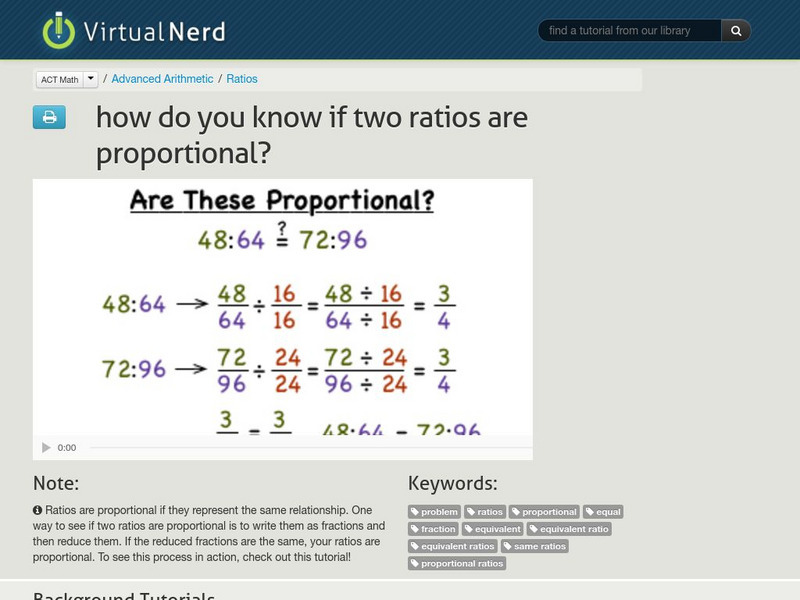
Virtual Nerd: How Do You Know if Two Ratios Are Proportional?
Ratios are proportional if they represent the same relationship. To see how to check if ratios are proportional, take a look at this tutorial. [4:34]
Khan Academy
Khan Academy: Proportional Relationships With Graphs
Learn how to tell proportional relationships by drawing graphs.
Sophia Learning
Sophia: Constant Rates of Change and Proportional Relationships
This video lesson provides examples of tables with proportional and non-proproptional relationships but have a constant rate of change.
Sophia Learning
Sophia: Direct Variation and Proportional Linear Relationships
Explore the relationship between direct variation and proportional linear relationships then assess learning with a quiz.
Sophia Learning
Sophia: Graphs of Constant Rates of Change
Compare two lines to determine which one is a constant rate of change.
Sophia Learning
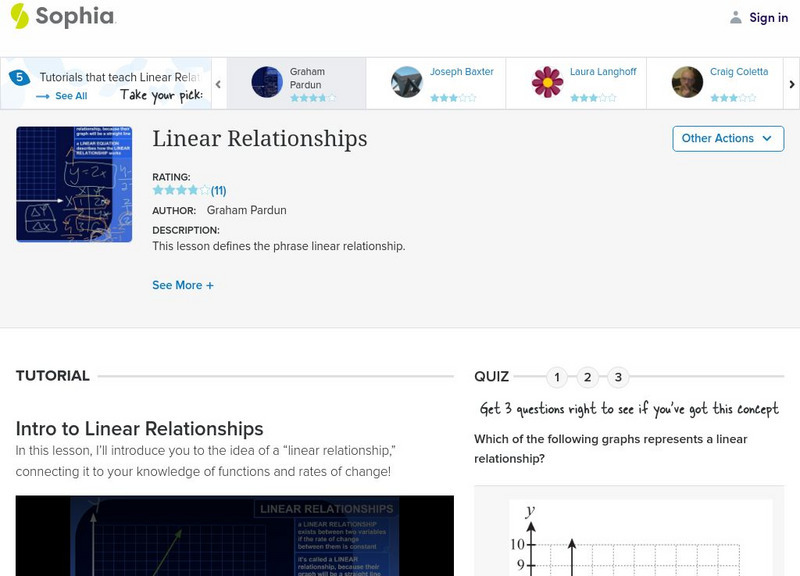
Sophia: Linear Relationships
Determine the linear relationship of equations by comparing the rate of change. Assess learning with a quiz.
Sophia Learning
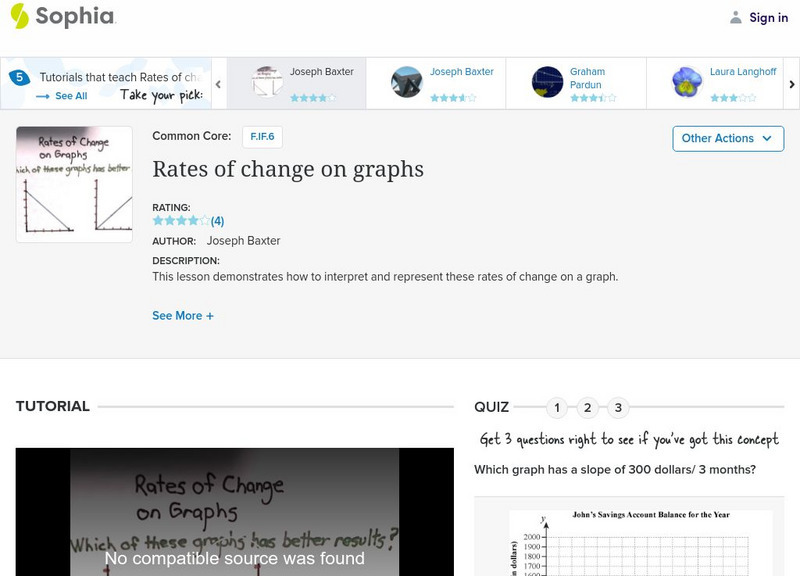
Sophia: Rates of Change on Graphs
Explore how to interpret and graph rates of change. Assess learning with a quiz.
Sophia Learning
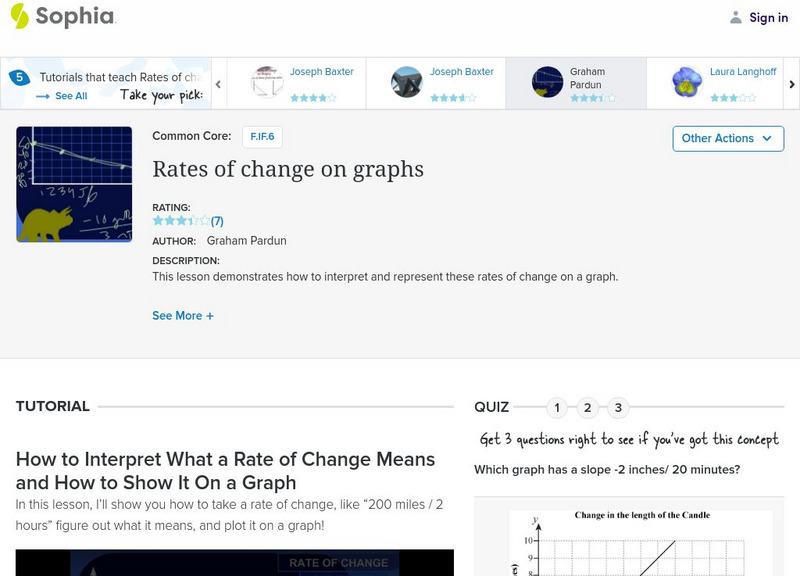
Sophia: Rates of Change on Graphs
Understand rate of change and how it is interpreted and represented on a graph. Assess learning with a quiz.


