TED-Ed
Cicadas: The Dormant Army Beneath Your Feet
What's the buzz that happens every 13 or 17 years? The emergence of the cicadas! This quick and flashy animation explains the lifecycle of these unusual insects and ponders the timing. On the host site, you will also find comprehension...
PBS
Career Connections | Bookkeeping and Accounting
Keeping track of the finances is the job of the accountant and the bookkeeper. Find out what skills add up to make it in the world of ledgers and numbers.
Anywhere Math
Frequency Tables and Histograms
If the shoe fits, include it in the display. The presentation uses shoe size to introduce organizing data within a frequency table and a histogram. Using another histogram, the video outlines how to interpret the data display. To...
PBS
Real-Life Math | Baseball
The math in baseball is more than just batting averages. The Assistant General Manager of the Diamondbacks shows the numerous ways the management uses baseball math. The class participates in an activity to simulate batting averages and...
Scholastic
Study Jams! Mean/Average
Join Zoe as she calculates the average number of points RJ scored in his basketball games. This step-by-step presentation clearly models the procedure for finding the mean of a data set, including examples with both whole number and...
Scholastic
Study Jams! Median
Zoe is curious how many goals her soccer team usually scores in a game. To answer the question, she walks through the process of finding the median of a data set in this step-by-step presentation. Examples are included that model how to...
Scholastic
Study Jams! Mode
Sam is running for class treasurer and Zoe wants to know if he won the election. Follow along as she counts up the votes and uses the mode to determine the winner. After viewing the presentation, work through the Try It! practice...
Annenberg Foundation
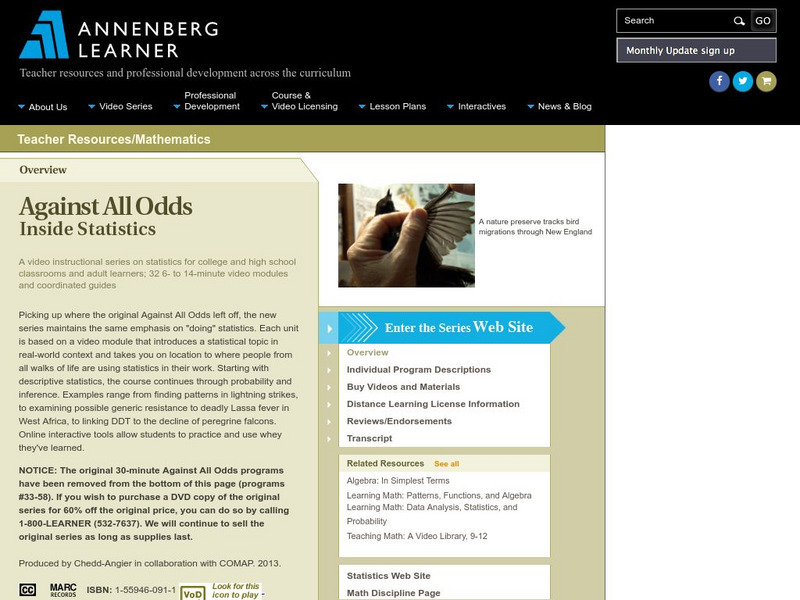
Annenberg Learner: Against All Odds: Histograms
Meteorologists use histograms to map when lightning strikes and this visualization technique helps them understand the data in new ways. [9:42]
Annenberg Foundation
Annenberg Learner: Against All Odds: Normal Distributions
A look at how histograms, and the curves that are drawn based on histogram data, can help one analyze data. Video program offers real-life examples to illustrate this: population age and baseball statistics. [28:40]
Math Mammoth
Math Mammoth: Mean, Median, and Mode: Measures of Central Tendency
In this lesson, students learn about measures of central tendency and how the mean, median, and mode work in different contexts. [9:25]
Khan Academy
Khan Academy: Shapes of Distributions
The video describes how to determine if the data displayed represents left-tailed, right-tailed, or symmetrical data distribution.
Khan Academy
Khan Academy: Statistics Intro: Mean, Median, & Mode
The video introduces statistics and explains the three different ways to describe the center of a data set.
Khan Academy
Khan Academy: Statistics: Average
Video briefly talks about types of statistics. Gives demonstration of how to find arithmetic mean, median and mode of a set of numbers. Discusses how well each measure represents the data set. Includes link to practice problems. [12:34]
Khan Academy
Khan Academy: Statistics: The Average
Introduction to descriptive statistics and central tendency. Gives demonstration of how to find arithmetic mean, median and mode of a set of numbers.
Sophia Learning
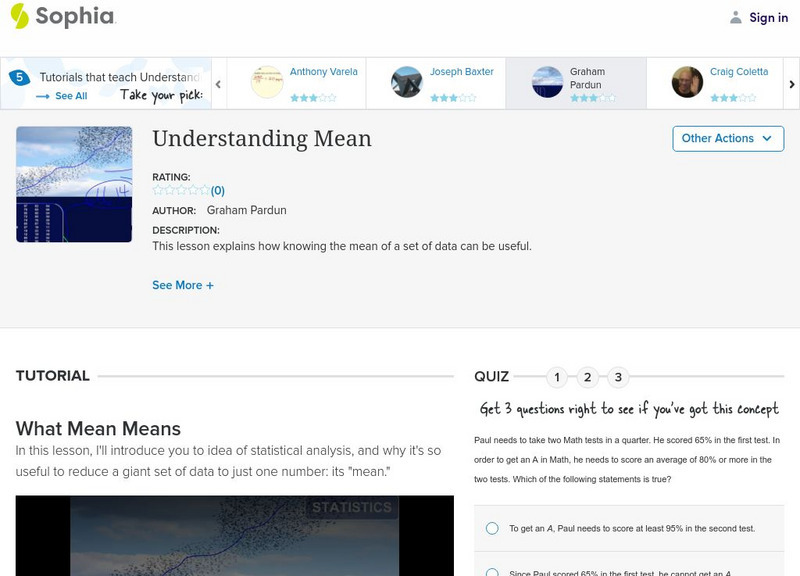
Sophia: Understanding Mean
Determine what the mean of a set of data is and how to calculate it. Assess learning with a quiz.
Imagine Learning Classroom
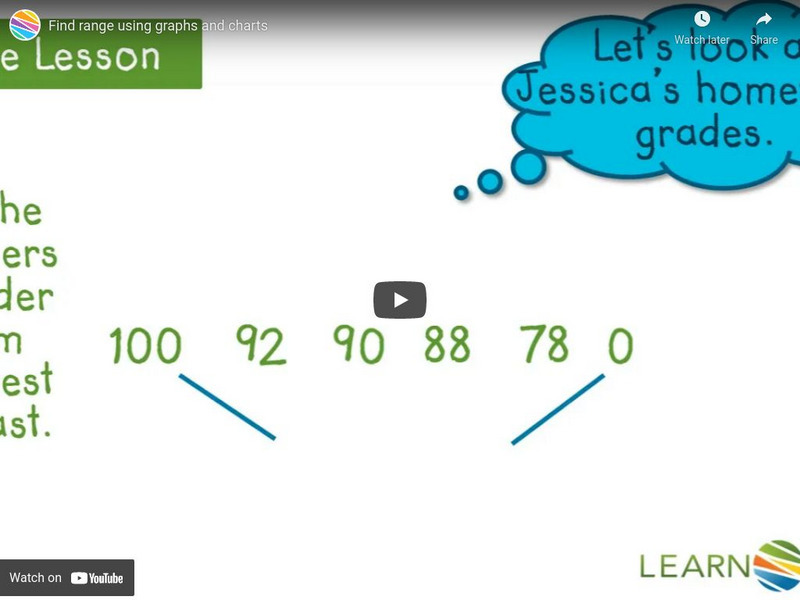
Learn Zillion: Find Range Using Graphs and Charts
In this lesson, you will learn to find the range of a given set of data including and excluding the outlier by using graphs and charts. Login gives access to a slideshow as well. [5:07]
Math Mammoth
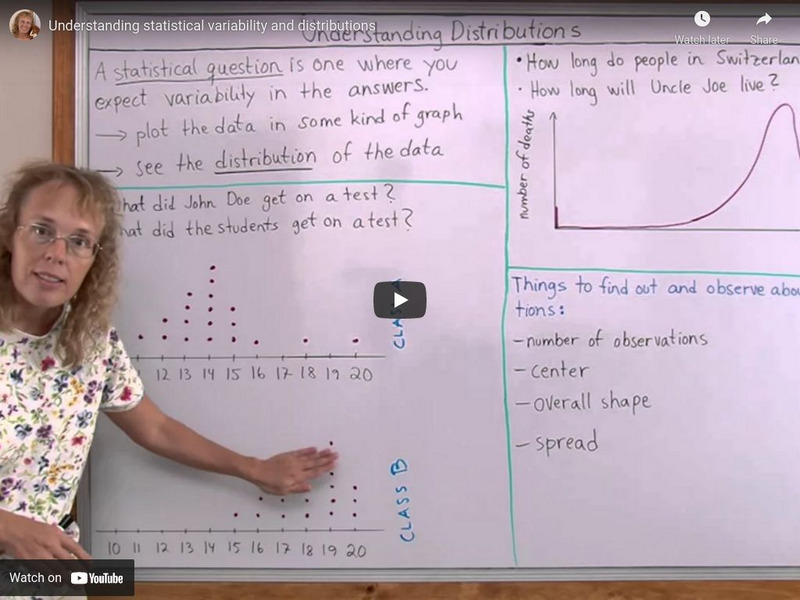
Math Mammoth: Understanding Statistical Variability and Distributions
This lesson explains what a statistical question is and how to describe the distribution of data by its center, spread, and shape. [7:08]
Virtual Nerd
Virtual Nerd: Find the Mode of a Data Set Where All the Numbers Are Different
This tutorial shows how to find the mode of a data set where all the numbers are different. [2:36]
Khan Academy
Khan Academy: Shapes of Distributions
This video discusses how to interpret a data display by looking at patterns and anomolies in the shape of its distribution. [5:06]
Sophia Learning
Sophia: Comparing Measures of Central Tendency: Lesson 3
Compare and contrast the appropriateness of different measures of central tendency for a given data set and recognize how linear transformations of one-variable data affect the data's mean, median, mode, and range. This lesson is 3 of 3...
Shmoop University
Shmoop: Histograms
Explore how to organize data with histograms through this video. [1:21]


