EngageNY
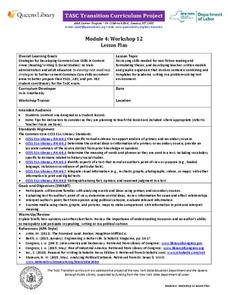
TASC Transition Curriculum: Workshop 12
How can opinions slant facts? Workshop participants learn how to examine primary and secondary sources and identify the author's point of view. They also examine how visual art impacts the meaning and rhetoric of sources. Full of...
Better Lesson
Better Lesson: Something's Fishy Working With Bar Graphs
In this lesson, students continue to build their graphing skills. This lesson also reinforces important mathematical skills like counting and comparing.
Better Lesson
Better Lesson: Fast Food Freddie Surveys and Bar Graphs
Students continue to build their graphing skills. They experience a real world application of graphing by organizing survey results.
Utah Education Network
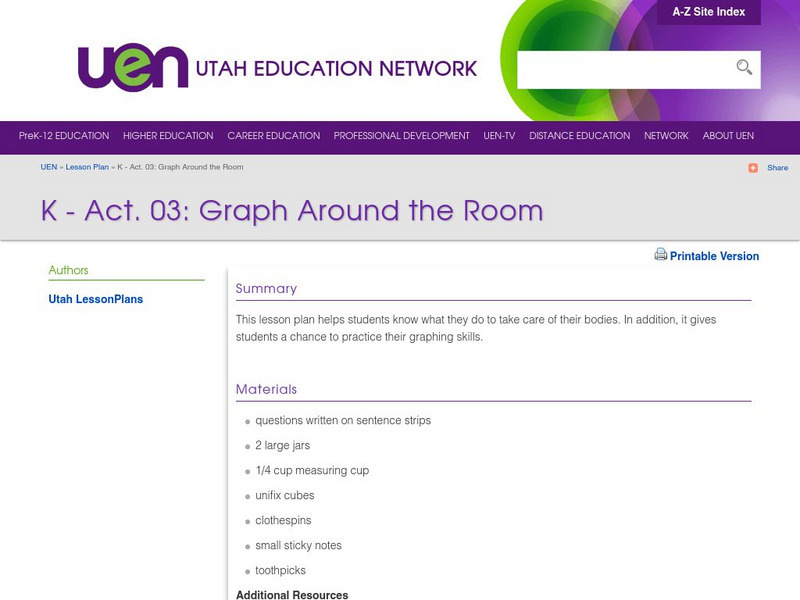
Uen: K Act. 03: Graph Around the Room
In this lesson, students will learn about how to keep good hygiene. While learning, students will practice their graphing skills.
TeachEngineering
Teach Engineering: Complex Networks and Graphs
Students learn about complex networks and how to represent them using graphs. They also learn that graph theory is a useful mathematical tool for studying complex networks in diverse applications of science and engineering, such as...
University of Canterbury
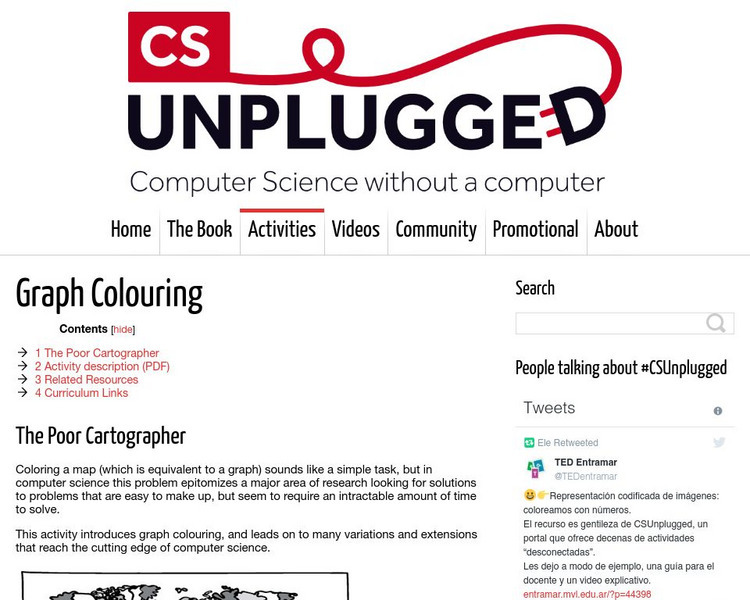
University of Canterbury: Cs Unplugged: Graph Colouring
Introduce graph coloring, and lead students on to many variations and extensions that reach the cutting edge of computer science.
Better Lesson
Better Lesson: Graphing Our Snack Mix: Review of Graphing
Second graders review how to make bar graphs, line plots, and pictographs by tallying the contents of snack mix and building graphs to show their data.
PBS
Pbs Learning Media: Graphs, Charts, and Tables: Targeted Math Instruction
At the end of this lesson about graphs, charts, and tables, students will be able to interpret and compare data from graphs (including circle, bar, and line graphs), charts, and tables.
Can Teach
Can Teach Lesson Plan: Graphing Constellations
In this lesson plan, students practice their graphing skills by following directions to recreate constellations.
Scholastic
Scholastic: Bars, Lines, and Pies
Middle schoolers will learn and reinforce skills for creating, applying and analyzing pie charts, bar graphs and line graphs.
Alabama Learning Exchange
Alex: What's in a Name: Graphing Lesson
A lesson that teaches students how to create and analyze a graph using the letters of their name. The lesson uses the book Chrysanthemum by Kevin Henkes (not included in the lesson plan) to start the discussion.
Illustrative Mathematics
Illustrative Mathematics: F if.c.7.a, a sse.b.3, F if.c.7: Graphs of Quadratic
During this task, students will realize that equivalent expressions produce the same graph. The activity will lead to discussions about the value of different forms of equations. Aligns with F-IF.C.7.a, A-SSE.B.3, and F-IF.C.7.
Alabama Learning Exchange
Alex: Great Golly Graphs
This lesson plan asks learners to create a survey project including graphs, questions, tables, and data analysis. It gives an assessment and ideas for remediation and extension as well as ways to manage behavior problems and reluctant...
Other
Elmwood Park High School: Vertex Edge Graphs
In this Unit, you will use vertex-edge graphs and Euler Circuits to help find optimum paths. Included are two lessons that help you develop the understanding and skill needed to solve problems about optimum paths and conflicts.
Science Education Resource Center at Carleton College
Serc: Investigating Motion Graphing Speed
In this introduction to motion activity, students will get a personal understanding of speed and acceleration by experiencing it firsthand. Wheeled office chairs or other cart like devices are used to give one student a ride as a fellow...
Center for Innovation in Engineering and Science Education, Stevens Institute of Technology
Ciese Real Time Data Projects: Weather Scope: A Study of Weather and Climate
Use real-time data to study factors that affect weather and climate, create weather instruments, and share data with students around the world.
Alabama Learning Exchange
Alex: Leo Lionni's Little Blue and Little Yellow
Students will use Leo Lionni's literature and his website to learn about the author, mix primary colors, summarize and rewrite a story, and use graphing skills to determine the classes' favorite color.
Better Lesson
Better Lesson: Graphing Data on a Graph
Second graders will be able to read and write data on a graph.
Better Lesson
Better Lesson: Graphing January's Weather
First graders graph the weather in Vermont for the month of January.
Better Lesson
Better Lesson: Graph Party
First graders will be involved in creating three different types of graphs and then be asked to answer questions about each representations data set.
Better Lesson
Better Lesson: Math Centers Review Previous Skills
Students will be able to independently practice graphing, teen numbers, and addition.
Alabama Learning Exchange
Alex: Getting to Know Your Classmates Using Bar Graphs
Middle schoolers will collect data from class using surveys. Students survey classmates concerning favorite movies, favorite color, shoe size, time spent studying, brand of cell phone and etc. From the data they will create bar graphs...
Alabama Learning Exchange
Alex: Misleading Graphs Are Da'pits!
In this interactive lesson, students will discover how creating an incorrect graph will display misleading information. Through viewing and discussing a variety of graphs, the students will identify 5 components that graphs must contain...
Illustrative Mathematics
Illustrative Mathematics: F Le Comparing Graphs of Functions
The goal of this task is to use appropriate tools to compare graphs of several functions. In addition, students are asked to study the structure of the different expressions to explain why these functions grow as they do. Aligns with...
Other popular searches
- Graphing Skills Lesson Plans
- Basic Graphing Skills
- Organizing and Graphing Data
- Introducing Graphing Skills
- Graphing Skills Using M&ms
- Graphing Skills in Science
- Graphing Skills for Prek
- Graphing Skills With Fruits
- Graphing Skills in Chemistry
- Graphing Skills for Perk
- Graphing Skills Worksheet
- Reading Graphing Skills


