Hi, what do you want to do?
EngageNY
TASC Transition Curriculum: Workshop 12
How can opinions slant facts? Workshop participants learn how to examine primary and secondary sources and identify the author's point of view. They also examine how visual art impacts the meaning and rhetoric of sources. Full of...
Texas Education Agency
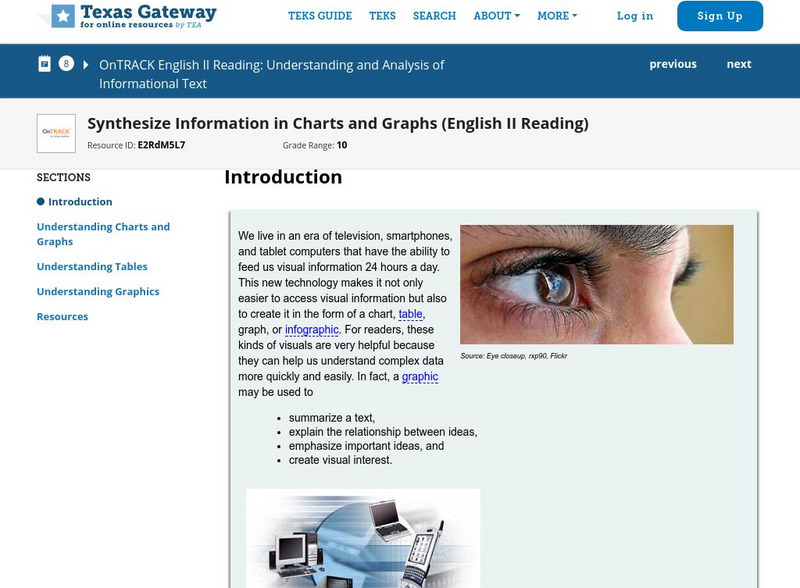
Texas Gateway: Informational Text: Synthesize Information in Charts and Graphs
In this lesson, you will learn how to understand the data found in charts and graphs, and at the end of the lesson, you will practice what you have learned.
Texas Education Agency
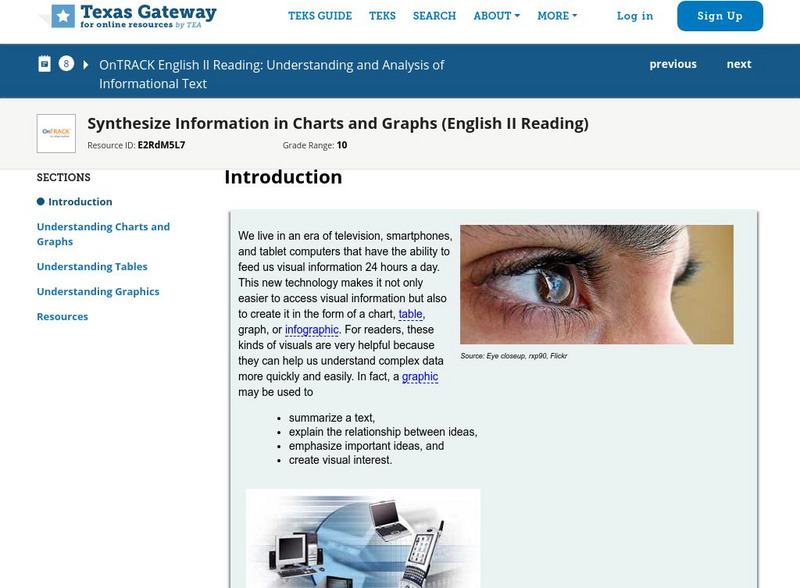
Texas Gateway: Synthesize Information in Charts and Graphs (English Ii Reading)
Synthesize information that you find in charts and graphs.
Texas Education Agency
Texas Gateway: Synthesize Information in Charts and Graphs (English Ii Reading)
Synthesize information that you find in charts and graphs.
Quia
Quia: Reading Charts and Graphs Quiz
This 25-question quiz asks students to read various kinds of charts and graphs and to select the correct answers to the questions. Immediate feedback is provided after each question. Java is required.
Grammarly
Grammarly Handbook: Visuals: Graphs, Charts, and Diagrams
This article explains that graphs, charts, and diagrams are used to display information visually. The choice of what type of graph or chart to use depends on the information to be displayed. Software programs make these much easier to...
Education Development Center
Tune in to Learning: Reading Charts and Graphs
Practice graph reading skills with these exercises and companion tutorials.
Other
The Topic: Charts and Graphs
Brief descriptions of charts and graphs, followed by links to larger sites on the same subject.
PBS
Pbs Learning Media: Graphs, Charts, and Tables: Targeted Math Instruction
At the end of this lesson about graphs, charts, and tables, students will be able to interpret and compare data from graphs (including circle, bar, and line graphs), charts, and tables.
Other
Hubspot: Data Visualization 101: How to Design Charts and Graphs
Your data is only as good as your ability to understand and communicate it, which is why choosing the right visualization is essential. Learn more in this guide.
Texas Education Agency
Texas Gateway: Evaluating Data in Tables, Graphs and Charts
[Accessible by TX Educators. Free Registration/Login Required] In this lesson students look at examples of graphics, tables, charts, and graphs, and learn how to interpret their data. They will be able to use this skill to enhance their...
Scholastic
Scholastic: Bars, Lines, and Pies
Students will learn and reinforce skills for creating, applying and analyzing pie charts, bar graphs and line graphs.
PBS
Pbs Kids Afterschool Adventure!: Operation: All About Us Activity Plan
It's time to stand in the spotlight! During this Afterschool Adventure, children will learn about and practice a variety of math skills as they gather information about their favorite subject-themselves! Children will start out by...
United Nations
United Nations: Dept. Of Social and Economic Affairs: Population Division
United Nations information on population issues of the world. Examples include long-range population projections, international migration, and population charts and graphs.
Science Buddies
Science Buddies: Scientific Method Data Analysis/graphs
At the end of your experiment you should review all of the data you have collected. See samples of data analysis charts and graphs. Find out what makes for a good chart or graph using the self-grading rubrics.
University of North Carolina
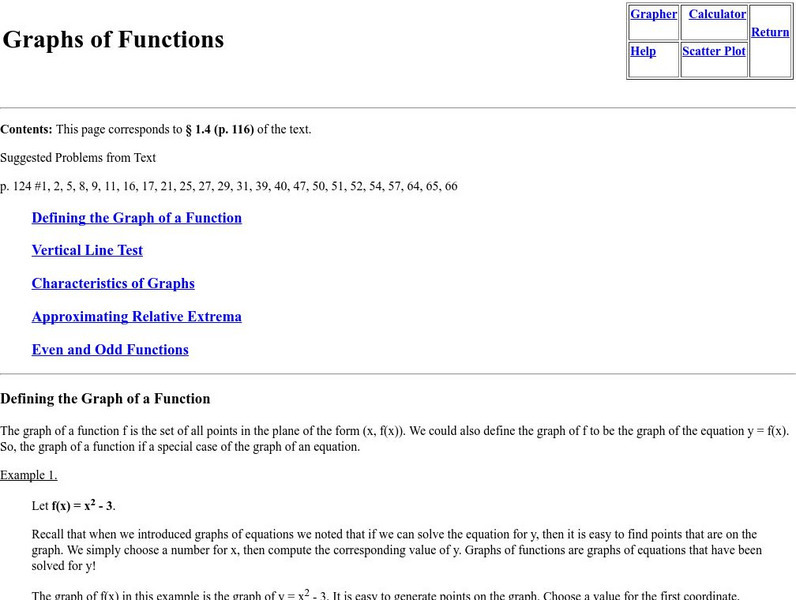
University of North Carolina Wilmington: Graphs of Functions
Defining the graph of a function, vertical line test, characteristics of graphs, approximating relative extrema, and even and odd functions are covered with examples that include charts and graphs.
E-learning for Kids
E Learning for Kids: Math: Elephant Plant: Data and Graphs
On this interactive website students practice various math skills using a real-life scenario involving plants. Those skills include interpreting data in a circle graph, interpreting data in a divided bar graph, and interpreting a bar...
E-learning for Kids
E Learning for Kids: Math: Group of Pyramids: Fractions and Graphs
On this interactive website, students practice various math skills using a real-life scenario at the pyramids. Those skills include showing percentages as fractions and decimals and interpreting data in a sector graph.
Texas A&M University
Wtamu Virtual Math Lab: Beginning Algebra: Reading Graphs
A good introduction to reading bar, line, and double line graphs, and drawing and reading Venn diagrams. Contains definitions and examples of these types of charts and graphs as well as practice exercises that ask you to answer questions...
Read Works
Read Works: The Olympics Then and Now
[Free Registration/Login Required] Students read two charts with information about the Olympics in ancient Greece and in modern times. A question sheet is available to help students build skills in comparing and contrasting.
National Center for Ecological Analysis and Synthesis, University of California Santa Barbara
Ucsb / Pie Graphs (Piece of Cake)
This page gives an example and easy-to-understand description of a pie graph (circle graph.) Also provides an opportunity for students to test their abilities to read a pie graph.
Beacon Learning Center
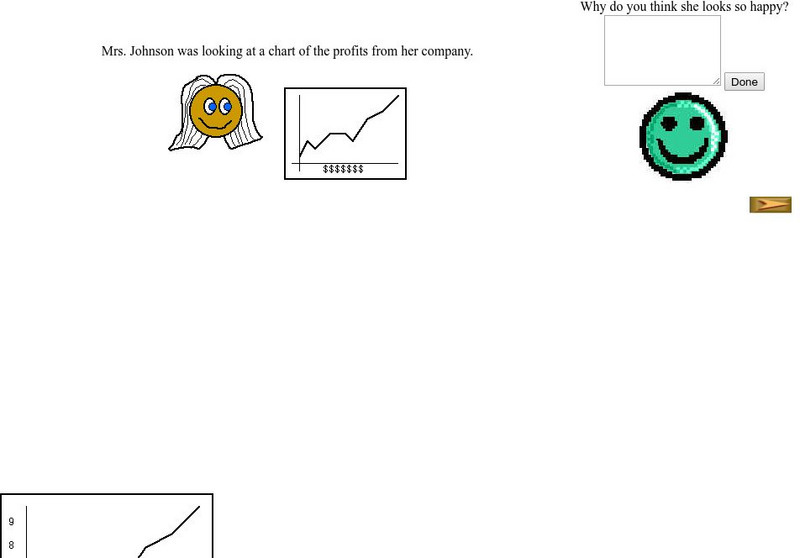
Beacon Learning Center: Interpreting Line Graphs
This site is a lesson on creating and interpreting a line graph. It explains how a line graph is created and then asks questions about what is learned from the data. Students type in open responses, and answers and feedback follow.
US Department of Education
National Center for Education Statistics: Create a Graph Tutorial
This tutorial walks students through how to create different types of graphs using the Create a Graph tool available on the website. Covers bar graphs, line graphs, pie charts, area graphs, scatter plots, and dependent and independent...
Utah Education Network
Uen: Balanced Diet
In this lesson, 2nd graders will learn about the components of a balanced diet. Students will analyze charts and then self-report their own foods in categories. Several fiction and nonfiction books are listed as additional resources.
Other popular searches
- Pie Charts and Graphs
- Reading Charts and Graphs
- Behavior Charts and Graphs
- Charts and Graphs Candy
- Interpret Charts and Graphs
- Charts and Graphs Christmas
- Charts and Graphs Math
- Analyzing Charts and Graphs
- Tables, Charts and Graphs
- Charts and Graphs Europe
- Using Charts and Graphs
- Bar Graphs and Charts


