Hi, what do you want to do?
Worthington City Schools
From Survive to Thrive: What Great Substitute Teachers Do Differently
Thinking about signing up as a substitute teacher? Subbing is not for the faint of heart but with the help of the thoughtful advice in a detailed guide, you can develop the skills you need to be a great, professional substitute teacher.
EngageNY
TASC Transition Curriculum: Workshop 12
How can opinions slant facts? Workshop participants learn how to examine primary and secondary sources and identify the author's point of view. They also examine how visual art impacts the meaning and rhetoric of sources. Full of...
Texas Education Agency
Texas Gateway: Evaluating Data in Tables, Graphs and Charts
[Accessible by TX Educators. Free Registration/Login Required] In this lesson students look at examples of graphics, tables, charts, and graphs, and learn how to interpret their data. They will be able to use this skill to enhance their...
ReadWriteThink
Read Write Think: Charting Characters for a More Complete Understanding
Contains plans for one 60-minute lesson plan that teaches about a reading strategy called Character Perspective Charting. In addition to student objectives and standards, these instructional plans contains links to PDF handouts and links...
Texas Education Agency
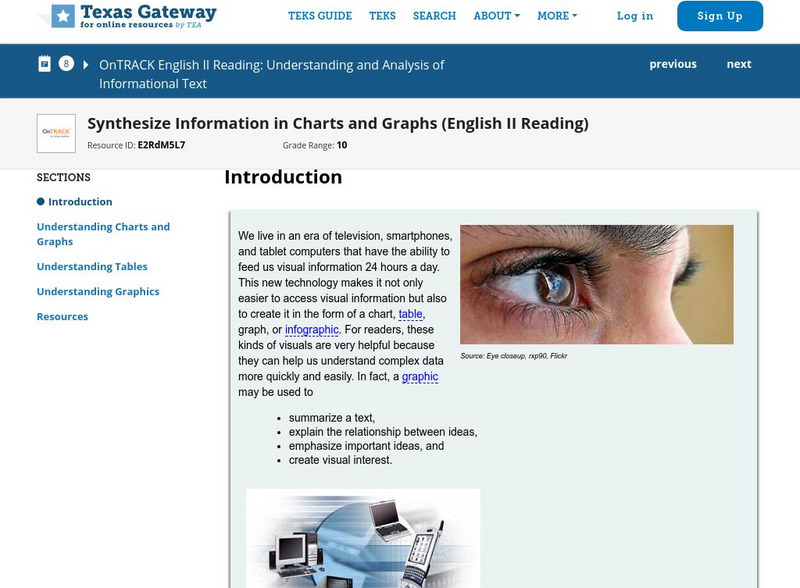
Texas Gateway: Informational Text: Synthesize Information in Charts and Graphs
In this lesson, you will learn how to understand the data found in charts and graphs, and at the end of the lesson, you will practice what you have learned.
Texas Education Agency
Texas Gateway: Synthesize Information in Charts and Graphs (English Ii Reading)
Synthesize information that you find in charts and graphs.
Cuemath
Cuemath: Pie Charts
A comprehensive guide for learning all about pie charts with definitions, solved examples, and practice questions.
Grammarly
Grammarly Handbook: Visuals: Graphs, Charts, and Diagrams
This article explains that graphs, charts, and diagrams are used to display information visually. The choice of what type of graph or chart to use depends on the information to be displayed. Software programs make these much easier to...
CK-12 Foundation
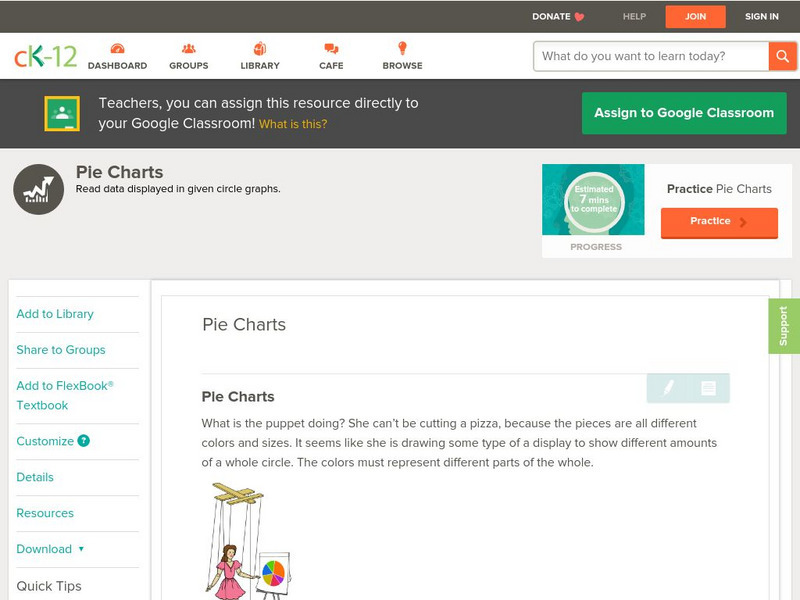
Ck 12: Statistics: Pie Charts Grades 9 10
[Free Registration/Login may be required to access all resource tools.] Covers representing data in a pie chart.
National Center for Ecological Analysis and Synthesis, University of California Santa Barbara
Ucsb / Pie Graphs (Piece of Cake)
This page gives an example and easy-to-understand description of a pie graph (circle graph.) Also provides an opportunity for students to test their abilities to read a pie graph.
Quia
Quia: Reading Charts and Graphs Quiz
This 25-question quiz asks students to read various kinds of charts and graphs and to select the correct answers to the questions. Immediate feedback is provided after each question. Java is required.
Daily Teaching Tools
Daily Teaching Tools: Vocabulary Charts
This Daily Teaching Tools resource provides two reproducible charts for vocabulary acquisition. Students can complete these charts as they encounter new vocabulary words or as a means of reviewing before a vocabulary quiz or test.
Sophia Learning
Sophia: Note Taking: Concept Maps and Flow Charts
This slideshow lesson focuses on note taking using concept maps and flow charts; it provides background information, 6 types of concept maps or flow charts with best uses, uses in the classroom, uses while reading or researching, and how...
Texas Education Agency
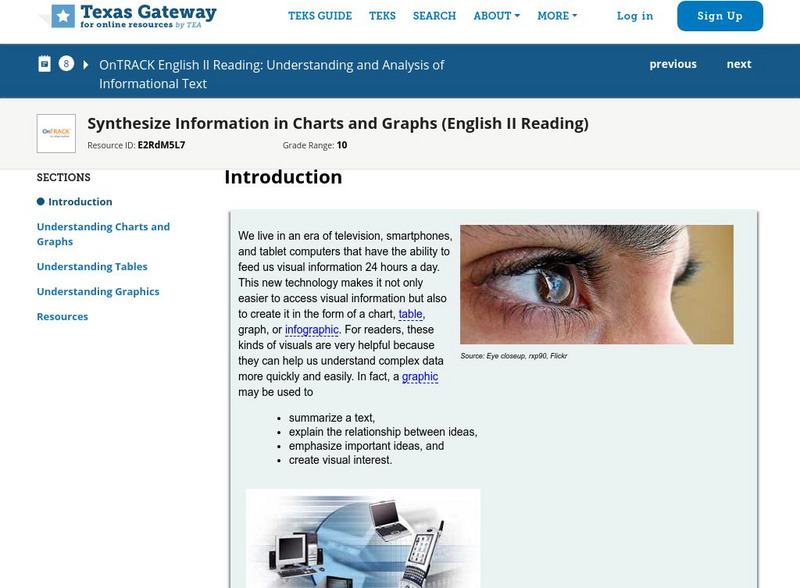
Texas Gateway: Synthesize Information in Charts and Graphs (English Ii Reading)
Synthesize information that you find in charts and graphs.
Math Is Fun
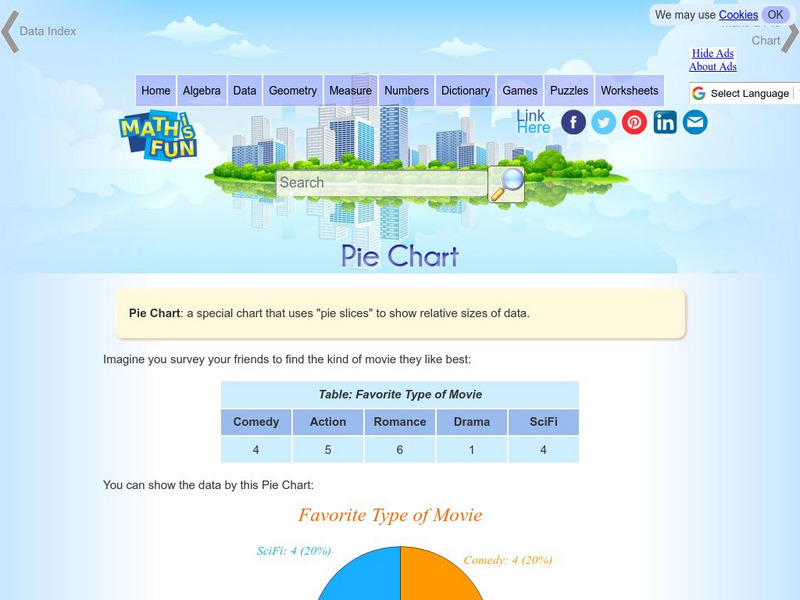
Math Is Fun: Pie Chart
Explains, with examples, what a pie chart is and how to make one. Includes a set of practice questions.
PBS
Pbs Learning Media: Graphs, Charts, and Tables: Targeted Math Instruction
At the end of this lesson about graphs, charts, and tables, students will be able to interpret and compare data from graphs (including circle, bar, and line graphs), charts, and tables.
University of Cambridge
University of Cambridge: Maths and Sports: Charting More Success
This activity follows on from Charting Success and encourages students to consider and analyse representations of data from the world of sport, to make sense of the stories they tell, and to analyse whether the right representation has...
Colorado State University
Colorado State Writing Center: Charts
The use of charts and graphs can improve your presentations, whether on paper or as visual aids. Here you can read about how to create line, column, bar, pie graphs, and scatterplots. Just follow the links to their respective pages.
CK-12 Foundation
Ck 12: Statistics: Pie Charts Grade 6
[Free Registration/Login may be required to access all resource tools.] Interpret circle graphs and make predictions based on the displayed data.
Shodor Education Foundation
Shodor Interactivate: Pie Chart
Students investigate how a pie chart can be used to display data graphically. The resource includes the activity and instructor resources.
PBS
Pbs: Off the Charts Web Karaoke
This online karaoke machine, developed for "Off the Charts," an episode about songwriters that aired on the award-winning PBS series "Independent Lens," lets you try out your songwriting talents. First you write the lyrics for a song set...
Other
The Topic: Charts and Graphs
Brief descriptions of charts and graphs, followed by links to larger sites on the same subject.
Other
Abp: P Ie Charts
This site from Accelerators and Beam Physics Group produces pertinent information regarding pie charts. Shows an example of a pie chart and breaks it up for easy learning.
Primary Resources
Primary Resources: Line Graphs and Pie Charts
Here are a few resources to use with your students when teaching about line graphs or pie charts.
Other popular searches
- Charts and Graphs
- Multiplication Charts
- Maps and Charts
- Tally Charts
- Pie Charts and Graphs
- Pie Chart
- Multiplication Charts to 100
- Reading Charts and Graphs
- Behavior Charts and Graphs
- Charts and Graphs Candy
- Interpret Charts and Graphs
- Charts and Graphs Christmas


