Grammarly
Grammarly Handbook: Visuals: Graphs, Charts, and Diagrams
This article explains that graphs, charts, and diagrams are used to display information visually. The choice of what type of graph or chart to use depends on the information to be displayed. Software programs make these much easier to...
Read Works
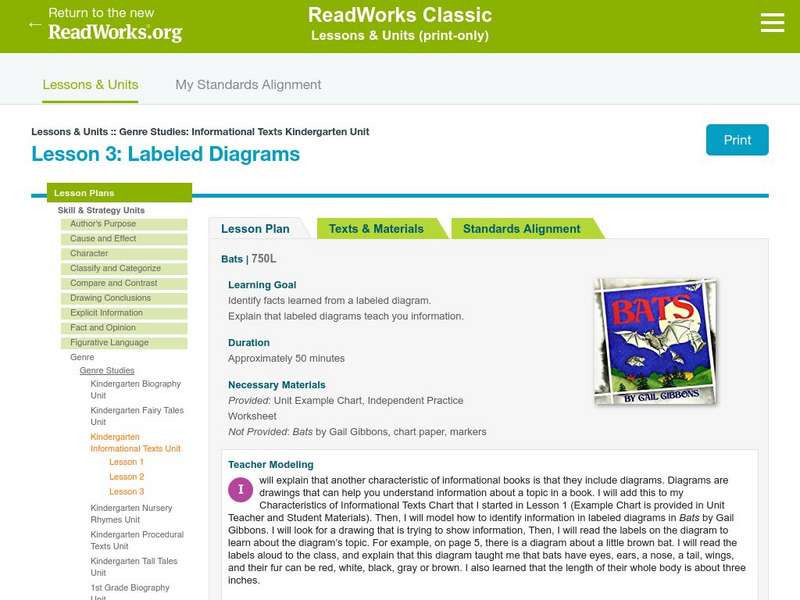
Read Works: Genre Studies: Informational Text Kindergarten Unit: Labeled Diagrams
[Free Registration/Login Required] Lesson uses Bats by Gail Gibbons to teach learners how to identify facts learned from labeled diagrams within an informational text. Ideas for direct teaching, guided practice, and independent practice...
Other
Reading Quest: Making Sense of Social Studies
Teaching students to read well in areas other than language arts requires teaching and reinforcing the kinds of reading strategies taught here. There are 27 strategies, ranging from brainstorming to word mapping. The site includes PDF...
Daily Teaching Tools
Daily Teaching Tools:more Graphic Organizers for Teaching Literature and Reading
This Daily Teaching Tools collection provides graphic organizers for teaching reading and literature. Elaborate graphic organizers are provided for the following: story maps, character study charts, making text connection maps, conflict...
Florida Center for Reading Research
Florida Center for Reading Research: Exp. Text Structure: Text Feature Find
A lesson plan in which young scholars look through a book to find various text features including: a table of contents, sequence and format, charts/graphs/maps, diagrams/graphics/illustrations, print variations, an index, and a glossary....
CK-12 Foundation
Ck 12: Elem Math: Using Real Maps English Lengths and Distances
[Free Registration/Login may be required to access all resource tools.] The video describes how to use a map to answer questions using the lengths provided in the diagram.
Texas A&M University
Wtamu Virtual Math Lab: Beginning Algebra: Reading Graphs
A good introduction to reading bar, line, and double line graphs, and drawing and reading Venn diagrams. Contains definitions and examples of these types of charts and graphs as well as practice exercises that ask you to answer questions...
Texas Education Agency
Texas Gateway: Evaluate Graphics in Informational/procedural Text
[Accessible by TX Educators. Free Registration/Login Required] In this lesson, you will learn to explain the function of the graphical components. You will also learn to evaluate graphics on how well they do what they are intended to do.
University of Cambridge
University of Cambridge: Nrich: Creating Cubes
On this one page website use a table to help you organize the information so that you can solve this cube problem. When you are finished you can check your answer right at the website.
University of Cambridge
University of Cambridge: Nrich: Alphabet Blocks
Help Santa and the elves keep track of how many blocks they need for their alphabet blocks. Solution provided.
University of Cambridge
University of Cambridge: Nrich: The Lily Pond
Using your problem solving skills find the best way for Freddie to visit Sammy. On this one page website the solution is right there for you when you have found a solution.
University of Cambridge
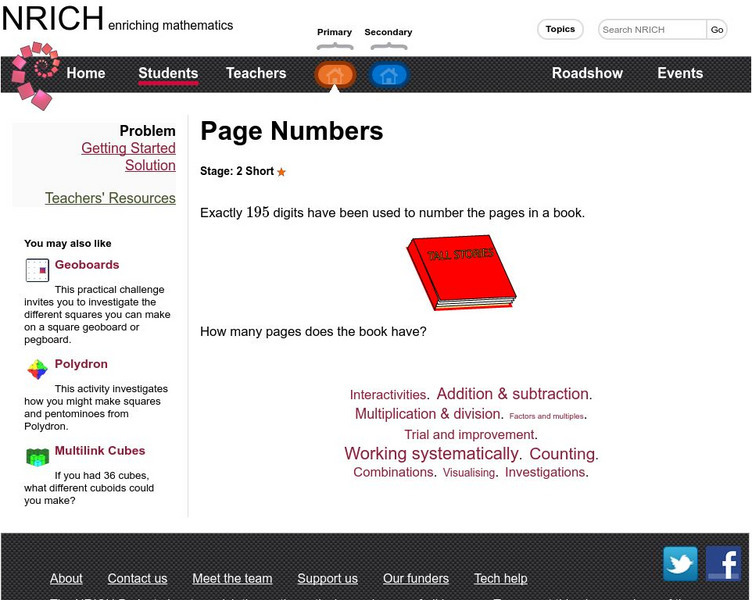
University of Cambridge: Nrich: Page Numbers
Exactly 195 digits have been used to number the pages in a book. How many pages does the book have? Sounds simple enough--if you have the right problem-solving skills. Solution provided.

