EngageNY
Modeling Riverbeds with Polynomials (part 2)
Examine the power of technology while modeling with polynomial functions. Using the website wolfram alpha, learners develop a polynomial function to model the shape of a riverbed. Ultimately, they determine the flow rate through the river.
Teach Engineering
Bone Density Math and Logarithm Introduction
What do logarithms have to do with bone density? Scholars learn that the equation for bone density includes logarithms. The majority of the third lesson of seven is devoted to logarithms and their properties.
EngageNY
Comparison of Numbers Written in Scientific Notation and Interpreting Scientific Notation Using Technology
Examine numbers in scientific notation as a comparison of size. The 14th lesson in the series asks learners to rewrite numbers as the same power of 10 in scientific notation to make comparisons. Pupils also learn how to use a calculator...
Teach Engineering
Bone Mineral Density Math and Beer's Law
Hop into a resource on Beer's Law. A PowerPoint presentation introduces Beer's law as part of calculating bone density from X-ray images in the sixth lesson in the series of seven. Individuals work on practice problems with this law and...
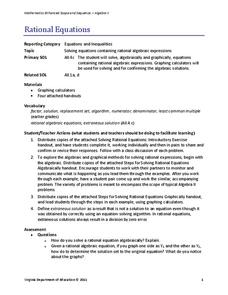
Virginia Department of Education
Rational Equations
Provide guidance and practice of the useful skill: solving rational equations using both an algebraic and graphical approach. Pupils solve increasingly more difficult rational equations using algebraic methods. After, they...
EngageNY
Are All Parabolas Congruent?
Augment a unit on parabolas with an instructive math activity. Pupils graph parabolas by examining the relationship between the focus and directrix.
EngageNY
Construct a Square and a Nine-Point Circle
Anyone can draw a square, but can you CONSTRUCT a square? Here is a resource that challenges math scholars to create steps to finish their own construction. They test their ability to read and follow directions to complete a construction...
Statistics Education Web
The United States of Obesity
Mississippi has both the highest obesity and poverty rate in the US. Does the rest of the data show a correlation between the poverty and obesity rate in a state? Learners tackle this question as they practice their skills of regression....
Statistics Education Web
Text Messaging is Time Consuming! What Gives?
The more you text, the less you study. Have classes test this hypothesis or another question related to text messages. Using real data, learners use technology to create a scatter plot and calculate a regression line. They create a dot...
Statistics Education Web
NFL Quarterback Salaries
Use statistics to decide if NFL quarterbacks earn their salaries! Learners study correlation coefficients after using technology to calculate regression equations. Through the data, they learn the meaning of correlation and correlation...
EngageNY
Modeling Riverbeds with Polynomials (part 1)
Many things in life take the shape of a polynomial curve. Learners design a polynomial function to model a riverbed. Using different strategies, they find the flow rate through the river.
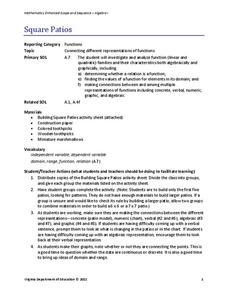
Virginia Department of Education
Square Patios
Build a patio from toothpicks and marshmallows to analyze functions! Learners look for patterns in the data as they create different size patios. As they discover patterns, they make connections between the different representations of...
EngageNY
Sampling Variability in the Sample Mean (part 1)
How accurate is data collected from a sample? Learners answer this question using a simulation to model data collected from a sample population. They analyze the data to understand the variability in the results.
Texas Education Agency (TEA)
Geometry in Architecture #1
Discover how to analyze architecture from a geometric standpoint. The fourth installment of an 11-part unit on architecture first provides a presentation on axis, balance, basic form, formal, pattern, proportion, symmetry, and tripartite...
Statistics Education Web
Saga of Survival (Using Data about Donner Party to Illustrate Descriptive Statistics)
What did gender have to do with the survival rates of the Donner Party? Using comparative box plots, classes compare the ages of the survivors and nonsurvivors. Using the same method, individuals make conclusions about the...
Statistics Education Web
It Creeps. It Crawls. Watch Out For The Blob!
How do you find the area of an irregular shape? Class members calculate the area of an irregular shape by finding the area of a random sampling of the shape. Individuals then utilize a confidence interval to improve accuracy and use a...
EngageNY
Definition of Translation and Three Basic Properties
Uncover the properties of translations through this exploratory lesson. Learners apply vectors to describe and verify transformations in the second installment of a series of 18. It provides multiple opportunities to practice this...
Code.org
Public Key Cryptography
Investigate how public key cryptography works. Scholars continue their study of one-way functions and asymmetric keys and apply this information to public key cryptography. They use an app to explore public key cryptography and its...
EngageNY
Normal Distributions (part 1)
Don't allow your pupils to become outliers! As learners examine normal distributions by calculating z-scores, they compare outcomes by analyzing the z-scores for each.
EngageNY
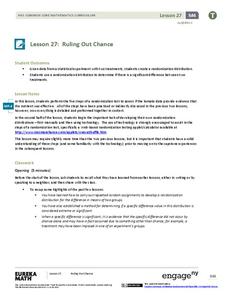
Ruling Out Chance (part 3)
Pupils analyze group data to identify significant differences. They use simulation to create their own random assignment data for comparison.
EngageNY
Distributions—Center, Shape, and Spread
Data starts to tell a story when it takes shape. Learners describe skewed and symmetric data. They then use the graphs to estimate mean and standard deviation.
EngageNY
Normal Distributions (part 2)
From z-scores to probability. Learners put together the concepts from the previous lessons to determine the probability of a given range of outcomes. They make predictions and interpret them in the context of the problem.
EngageNY
Sampling Variability in the Sample Proportion (part 1)
Increase your sample and increase your accuracy! Scholars complete an activity that compares sample size to variability in results. Learners realize that the greater the sample size, the smaller the range in the distribution of sample...
EngageNY
Sampling Variability in the Sample Proportion (part 2)
Increase your sample and increase your accuracy! Scholars complete an activity that compares sample size to variability in results. Learners realize that the greater the sample size, the smaller the range in the distribution of sample...
Other popular searches
- Math Technology
- Educational Technology Math
- Immigrant Math Technology
- Math and Technology
- Math Technology Projects
- Math Assistive Technology
- Math Technology Triangles
- Math Technology Excel
- Computer Technology Math
- Surveys Math Technology
- Math Technology Lesson Plans
- Math Technology Lesson


