CK-12 Foundation
Graphs for Discrete and for Continuous Data: Discrete vs. Continuous Data
Not all data is the same. Using the interactive, pupils compare data represented in two different ways. The learners develop an understanding of the difference between discrete and continuous data and the different ways to represent each...
CK-12 Foundation
Discrete Random Variables: Roll the Dice!
And the winner is ... not always who it appears to be. An interactive gives the directions for a dice game that on the surface gives one player an advantage over the other. Pupils look closer at the possible outcomes and find the...
CK-12 Foundation
Expected Value: Creating a Discrete Probability Distribution Table
Wanna roll the dice? Determine whether it is a good idea to play a dice game. An interactive presents the rules for a game of dice. Pupils find the probabilities of each event and calculate the expected value of the game. They finish...
Curated OER
Addition 1-5
Counting discrete objects and writing the corresponding number is the first steps little ones need to master before they can add or subtract. There are 4 sets of objects for them to count, sets are composed on 3,4, or 5 objects.
Curated OER
Presentation of Quantitative Data- Vertical Line Diagrams
In this quantitative data worksheet, students examine how vertical line diagrams can be used to display discrete quantitative data. They read about the use of tally charts to create vertical line graphs that display the data. They...
Mathematics Vision Project
Module 3: Polynomial Functions
An informative module highlights eight polynomial concepts. Learners work with polynomial functions, expressions, and equations through graphing, simplifying, and solving.
CK-12 Foundation
Domain and Range of a Function: Making Money Math
Graphs are useful for many things, including seeing how much money you can make. Individuals create a graph of earnings from a job based on the number of hours. They determine the domain and range of the graph and answer challenge...
Curated OER
Mean, Median, and Mode for Frequency Tables
In this mean, median, and mode activity, students solve 10 short answer problems. Kids find the mean, median, and mode of various data sets. Students make frequency tables from the data sets.
MacArthur Memorial
In Their Shoes: WWI Through the Eyes of Early Participants
Several social activities provide showcase the perspective of many prominent figures in World War I history. Students read an assigned case study about a memorable person and complete several activities to further understand this...
Mathematics Vision Project
Module 4: Rational Functions
Time to study the most sensible function — rational functions! The seven-lesson unit develops the concept of a rational function through a connection to rational numbers and fractions. Scholars graph functions, solve equations, and...
Mathematics Vision Project
Module 2: Linear and Exponential Functions
Write, graph, and model all things linear and exponential. Building on the previous module in a nine-part Algebra I series, learners compare linear exponential modeling. They write equations, graph functions, and analyze key features.
Charleston School District
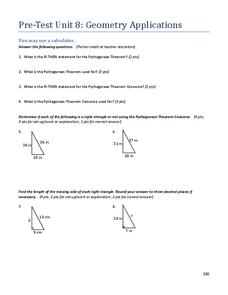
Pre-Test Unit 8: Geometry Applications
What does a squared and b squared make? C squared of course! The pre-test assesses eighth graders' knowledge of the Pythagorean Theorem, application of the Pythagorean Theorem, and finding volumes of solids.
Charleston School District
Pre-Test Unit 7: Real Numbers
Don't be irrational! Use this pre-test to assess your classes' ability to work with all types of real numbers. The lesson asks learners to estimate value, evaluate roots, and order numbers. This begins a series of lessons on the real...
Balanced Assessment
Tie Breaker
Develop a tie-breaking policy to determine a league champion. The assessment presents a scenario of finding a champion of a league with three teams tied. Pupils devise and defend a system that allows for only one team to be determined...
Curated OER
ESL: commonly Confused Words-Quiz 4
This quiz provides learners an opportunity to assess their understanding of several commonly confused words. Words like cloths and clothes, pail and pale, and sense and since are included. It's beneficial to discuss some of these...
Curated OER
Teaching Game Play Concepts
Some children with autism need to be prepped prior to game play, and game play concepts need to be introduced and reinforced. This short yet informative article will help you know how to get the kids in your special ed class ready for...
Curated OER
Data Management and Probability: Applications
In this data management and probability applications worksheet, 8th graders solve 20 various types of probability problems. They find the mean, median, mode and range of various numbers. Then, students use the spinner illustration to...
Curated OER
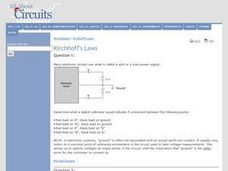
Kirchhoff's Laws
In this circuit worksheet students study electronic circuits and how they get power. Students determine polarity and magnitude and work with Kirchoffs laws to answer 48 questions regarding circuits. Answers are revealed when selected.
Curated OER
Phasor Mathematics
In this mathematics worksheet, students solve 13 questions on series, factorial, phase mathematics and calculus. They define what phasor means.
Curated OER
Performance-based Assessments for AC circuit Competencies
In this electronics worksheet, students predict the behavior of 51 circuits and compare their prediction with actual values. They make the necessary corrections when values don't match.
Curated OER
BJT Amplifier Troubleshooting
In this electrical circuit worksheet, students answer a series of 11 open-ended questions about BJT amplifiers and how to troubleshoot these circuits. This worksheet is printable and the answers are revealed online.
Curated OER
Handling Data- Health Statistics
In this social studies worksheet, students organize 50 country cards into groups. Students analyze a chart and group countries according to lowest, middle, and highest Infant Mortality Rate.
Curated OER
Design Project: Simple component curve-tracer circuit
In this circuit activity students complete a series of short answer questions on using a tracer circuit. There are answers with this activity.
Curated OER
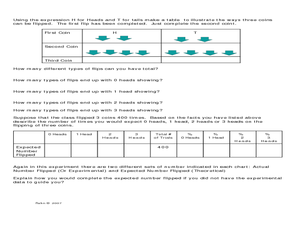
Let's Flip a Coin
For this probability worksheet, learners use a TI graphing calculator to simulate flipping a coin and compare their results (experimental probability) to the expected results (theoretical probability). The five page worksheet...


