CK-12 Foundation
Graphs for Discrete and for Continuous Data: Discrete vs. Continuous Data
Not all data is the same. Using the interactive, pupils compare data represented in two different ways. The learners develop an understanding of the difference between discrete and continuous data and the different ways to represent each...
Corbett Maths
Discrete and Continuous Data
Let's be discrete about the types of data. A short video provides the definitions of discrete and continuous data. After providing the definitions, the resource takes different types of data and sorts them based on type and provides an...
Curated OER
Data Collection and Presentation
Middle and high schoolers collect and analyze data from four different activities. The activities include information about classmates, tallying colors of cars in a parking lot, stem and leaf plots, and making a histogram from...
Curated OER
Presentation of Quantitative Data- Vertical Line Diagrams
In this quantitative data worksheet, students examine how vertical line diagrams can be used to display discrete quantitative data. They read about the use of tally charts to create vertical line graphs that display the data. They...
Curated OER
Data Management and Probability: Applications
In this data management and probability applications worksheet, 8th graders solve 20 various types of probability problems. They find the mean, median, mode and range of various numbers. Then, students use the spinner illustration to...
Curated OER
Frequency Tables; Discrete Ungrouped Data
In this frequency tables activity, students utilize given data to work out three frequency charts with one containing values and a pie chart involving angles for each value. Students complete three vertical line diagrams and check all...
Curated OER
Quantitative Data
In this quantitative data worksheet, pupils compute measures of central tendency, draw vertical line diagrams, and compare collected data. This 23-page worksheet contains approximately 100 multi-step problems. Explanations and examples...
Curated OER
Making Predictions from Data with a Graphing Calculator
In this making predictions from data worksheet, students solve 15 short answer problems. Students determine average miles per gallon given data on miles traveled and gas used. Students make predictions using the data and a line of best fit.
Curated OER
Types of Data
In this data chart instructional activity, students read the directions and study the examples to learn the difference between qualitative, quantitative, discrete and continuous data. Students answer 24 questions. This page is intended...
Bowland
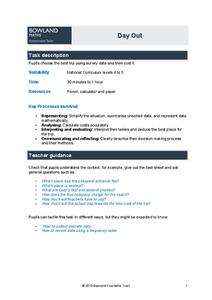
Day Out
Use mathematics to help plan a field trip. Scholars use the results of a survey to determine where a class should go on a field trip. They use provided data about entrance fees and mileage to calculate the cost per person of such a...
Curated OER
Handling Data- Health Statistics
In this social studies worksheet, students organize 50 country cards into groups. Students analyze a chart and group countries according to lowest, middle, and highest Infant Mortality Rate.
Curated OER
Numerical Analysis: Discrete Least Squares
In this discrete least squares learning exercise, students use a linear algebra approach to discrete last squares approximation. This two-page learning exercise contains approximately 10 problems.
Balanced Assessment
Tie Breaker
Develop a tie-breaking policy to determine a league champion. The assessment presents a scenario of finding a champion of a league with three teams tied. Pupils devise and defend a system that allows for only one team to be determined...
Curated OER
Mean, Median, and Mode for Frequency Tables
In this mean, median, and mode activity, students solve 10 short answer problems. Kids find the mean, median, and mode of various data sets. Students make frequency tables from the data sets.
Mathematics Vision Project
Module 4: Rational Functions
Time to study the most sensible function — rational functions! The seven-lesson unit develops the concept of a rational function through a connection to rational numbers and fractions. Scholars graph functions, solve equations, and...
Curated OER
Recycling Statistics
For this environment worksheet, students look for the answers to the environmental impact of recycling in Great Britain with the statistics from the pie graph.
Curated OER
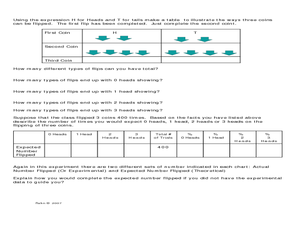
Let's Flip a Coin
For this probability worksheet, learners use a TI graphing calculator to simulate flipping a coin and compare their results (experimental probability) to the expected results (theoretical probability). The five page worksheet...
Curated OER
Clothing Choices
In this combinations worksheet, students circle the letter for the group that shows all the different combinations of 1 coat, 1 hat, and 1 scarf. They look at clip art pictures of 2 hats, 2 scarves, and 2 coats and decide which grouping...
Cuemath
Cuemath: Discrete Data
A comprehensive guide for learning all about discrete data with definitions, the difference between discrete and continuous data, graphical representation of discrete data through visualization, solved examples, and interactive questions...
Sophia Learning
Sophia: Continuous vs Discrete Data
Explore continuous and discrete data and when to use one over the other.
Sophia Learning
Sophia: Continuous vs Discrete Data
Explore continuous and discrete data and determine when to use each one.
Sophia Learning
Sophia: Discrete Data
Explore the term discrete data and look at examples for further explanation.
Mangahigh
Mangahigh: Data: Understand Discrete and Continuous Data
This site provides students practice with the concept of discrete and continuous data. Students can learn about the topic by completing an interactive tutorial. Students can then take a ten question timed test to practice the skill.
Texas Education Agency
Texas Gateway: Tea Statistics: Discrete Distribution (Playing Card Experiment)
In this Stats lab, students will work with a set of playing cards and a calculator. They will compare empirical data and a theoretical distribution to determine if an everyday experiment fits a discrete distribution. They will compare a...
Other popular searches
- Continuous and Discrete Data
- Continuous Discrete Data
- Statistics Discrete Data
- Continuous or Discrete Data
- Numerical Discrete Data
- Discrete Data Graphs


