American Statistical Association
An A-MAZE-ING Comparison
Teach your class how to use descriptive statistics through a hands-on data collection activity. Pupils collect their own data, calculate test statistics, and interpret the results in context. They compare male and female results, looking...
Statistics Education Web
First Day Statistics Activity—Grouping Qualitative Data
Making groups of groups can help to organize data. Classes use statistics to group themselves using descriptive adjectives. The objective is for learners to understand that grouping qualitative data is useful when the original groups are...
NASA
Exploring Data
Bring the sun to your class! Young scholars analyze actual solar wind data in the second lesson of a five-part series. Their analysis includes speed, temperature, and density data.
University of Georgia
Heating and Cooling of Land Forms
Compare heating and cooling rates of different land forms. A lab activity has groups collect data on the rate of heating and cooling of soil, grass, saltwater, fresh water, and sand. An analysis of the rates shows how the different land...
EngageNY
Summarizing Bivariate Categorical Data in a Two-Way Table
Be sure to look both ways when making a two-way table. In the lesson, scholars learn to create two-way tables to display bivariate data. They calculate relative frequencies to answer questions of interest in the 14th part of the series.
EngageNY
Using Sample Data to Estimate a Population Characteristic
How many of the pupils at your school think selling soda would be a good idea? Show learners how to develop a study to answer questions like these! The lesson explores the meaning of a population versus a sample and how to interpret the...
American Statistical Association
Colors Challenge!
Does writing the name of a color in a different colored ink affect one's ability to read it? Scholars design an experiment to answer this question. They collect the data, analyze the statistics, and draw a conclusion based on...
Statistics Education Web
Population Parameter with M-and-M's
Manufacturers' claims may or may not be accurate, so proceed with caution. Here pupils use statistics to investigate the M&M's company's claim about the percentage of each color of candy in their packaging. Through the activity,...
Statistics Education Web
The Case of the Careless Zookeeper
Herbivores and carnivores just don't get along. Using a box of animal crackers, classes collect data about the injury status of herbivores and carnivores in the box. They complete the process of chi-square testing on the data from...
Statistics Education Web
10,000 Steps?
Conduct an experiment to determine the accuracy of pedometers versus pedometer apps. Class members collect data from each device, analyze the data using a hypothesis test, and determine if there is a significant difference...
University of Georgia
Freezing and Melting of Water
Examine the behavior of energy as water freezes and melts. An engaging activity provides a hands-on experience to learners. Collaborative groups collect data and analyze the graphs of the temperature of water as it freezes and then...
Cornell University
Density
Certain things just do not mix, including liquids of varying densities. Learners collect data to determine the densities of several liquids. They then use the density information to predict the type of liquid.
Statistics Education Web
How High Can You Jump?
How high can your pupils jump? Learners design an experiment to answer this question. After collecting the data, they create box plots and scatter plots to analyze the data. To finish the lesson, they use the data to draw conclusions.
Statistics Education Web
Walk the Line
How confident are you? Explore the meaning of a confidence interval using class collected data. Learners analyze data and follow the steps to determine a 95 percent confidence interval. They then interpret the meaning of the confidence...
Code.org
Identifying People with Data
How much information about you is out there? Scholars explore this question as they investigate data breaches and how these violations occur. They then take part in an activity where they research how easily people could get access to...
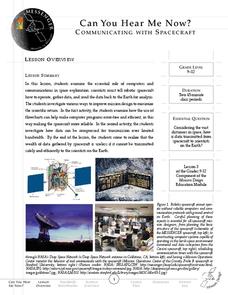
Messenger Education
Can You Hear Me Now?—Communicating with Spacecraft
Radio signals transmitted to Pluto take five hours to reach their destination! In these two activities, young scientists explore data communication in space. In activity one, pupils learn how data is gathered and sent back to Earth....
Statistics Education Web
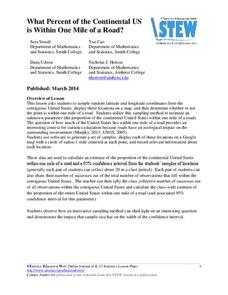
What Percent of the Continental US is Within One Mile of a Road?
There are places in the US where a road cannot be found for miles! The lesson asks learners to use random longitude and latitude coordinates within the US to collect data. They then determine the sample proportion and confidence interval...
EngageNY
Drawing a Conclusion from an Experiment (part 1)
Challenge your classes to complete an experiment from beginning to end. Learners make their own hypotheses, collect and analyze their own data, and make their own conclusions. They are on their way to becoming statisticians!
EngageNY
Types of Statistical Studies
All data is not created equal. Scholars examine the different types of studies and learn about the importance of randomization. They explore the meaning of causation and when it can be applied to data.
Statistics Education Web
Types of Average Sampling: "Household Words" to Dwell On
Show your classes how different means can represent the same data. Individuals collect household size data and calculate the mean. Pupils learn how handling of the data influences the value of the mean.
Purdue University
Getting the Dirt on Decomposition
Sometimes science requires getting a little dirty. A hands-on lesson explores the idea of decomposition by building a compost structure. Using red worms and dirt, individuals build and collect data on the rate of decomposition. The STEM...
Chicago Botanic Garden
Plant Phenology Data Analysis
Studying data over time can paint a pretty interesting picture. Learners use data they collected in the previous instructional activity to compare to historical data in a similar region. They graph the data of the first bloom of a...
Statistics Education Web
Now You SeeIt, Now You Don't: Using SeeIt to Compare Stacked Dotplots to Boxplots
How does your data stack up? A hands-on activity asks pupils to collect a set of data by measuring their right-hand reach. Your classes then analyze their data using a free online software program and make conclusions as to the...
Statistics Education Web
Did I Trap the Median?
One of the key questions in statistics is whether the results are good enough. Use an activity to help pupils understand the importance of sample size and the effect it has on variability. Groups collect their own sample data and compare...
Other popular searches
- Collecting and Recording Data
- Data Collection Techniques
- Math Lessons Data Collection
- Data Collection Activity
- Data Collection and Median
- Data Collection and Graphs
- Data Collection Projects
- Data Collection and Analysis
- Accurate Data Collection
- Data Collection Lesson Plans
- Experimental Data Collection
- Collection of Data


