Curated OER
Energy Audit
Students collect data about energy usage and use mathematical calculations to analyze their data. In this energy conservation and statistics math lesson, students survey their homes to complete an energy usage worksheet. Students...
Curated OER
Independent Plant Growth Experiment
This is an awesome lesson filled with tons of engaging learning activities. Over a period of weeks learners will make observations, collect plant and analyze plant data, read and review agricultural articles, design and conduct an...
Curated OER
Ornithology and Real World Science
Double click that mouse because you just found an amazing lesson! This cross-curricular Ornithology lesson incorporates literature, writing, reading informational text, data collection, scientific inquiry, Internet research, art, and...
Curated OER
Fish Communities in the Hudson
Learning to read data tables is an important skill. Use this resource for your third, fourth, or fifth graders. Learners will will study tables of fish collection data to draw conclusions. The data is based on fish environments in the...
Virginia Department of Education
Exploring Statistics
Collect and analyze data to find out something interesting about classmates. Groups devise a statistical question and collect data from their group members. Individuals then create a display of their data and calculate descriptive...
National Security Agency
Line Plots: Frogs in Flight
Have a hopping good time teaching your class how to collect and graph data with this fun activity-based lesson series. Using the provided data taken from a frog jumping contest, children first work together creating a line plot of the...
Curated OER
Comparing Data on Graph A and Graph B
Second graders gather and graph data. In this graphing lesson, 2nd graders collect data and graph this information using tally charts, bar graphs, pictographs, or tables. They make predictions about the outcomes.
Curated OER
Data Analysis: Infiltration Rate and Composition of Concrete
Learners collect and graph data. In this statistics activity, students analyze data using a spreadsheet program. They display their data effectively and analyze it.
Curated OER
Weather, Data, Graphs and Maps
Students collect data on the weather, graph and analyze it. In this algebra lesson, students interpret maps and are able to better plan their days based on the weather reading. They make predictions based on the type of clouds they see.
Curated OER
Gathering Data to Problem Solve
Learners, while using reading and writing strategies (subheads, prediction, skim, details, drawing inferences, etc,), solve math problems that involve gathering and representing data (addition, subtraction, multiplication). They practice...
Curated OER
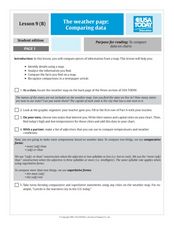
The Weather Page-Comparing Data
Learners examine weather patterns in the United States. In this weather lesson, students use a United States map to identify high and low temperatures in two states. Learners compare the data and record their findings onto a chart.
Curated OER
Regents High School Examination: Living Environment 2005
The 2005 version of the Regents High School Examination in the area of ecology is as comprehensive as previous years' exams. It consists of 40 multiple choice questions on everything from the structure of DNA to the interactions within...
Curated OER
What Do Maps Show?
This teaching packet is for grades five through eight, and it is organized around geographic themes: location, place, relationships, movement, and regions. There are four full lessons that are complete with posters, weblinks, and...
Curated OER
Redistricting: Drawing the Lines
Difficult redistricting concepts are covered in a context that will make it understandable to your government scholars. They begin with a KWL on the term redistricting and then watch a video to answer some questions. They analyze...
Curated OER
Using Word Processing to Create Graphic Organizers
Middle schoolers create a graphic organizer and instructional rubric using word processing software. They conduct Internet research at the History Alive website, and publish an essay.
EduGAINs
Data Management
Using a carousel activity, class members gain an understanding of the idea of inferences by using pictures then connecting them to mathematics. Groups discuss their individual problems prior to sharing them with the entire class. The...
Curated OER
Fish and zooplankton habitat through remote sensing
Students are exposed to the variety of ways in which scientist use remote sensing and it used in everyday life. They investigate about zooplankton and fish. Students list the two important groups of organisms in both aquatic and marine...
NASA
Developing an Investigation
Watch as your class makes the transition from pupils to researchers! A well-designed lesson has scholars pick a solar wind characteristic to research. They then collect and analyze official data from the LANL website. This is the third...
Beacon Learning Center
Line Plots
Introduce line plots, show examples of tables, graphing on a number line, and engage in a class discussion. Share the process by which statistical data is organized and displayed on a number line. Examples and worksheets are included....
Curated OER
Bird Ecology Unit
Tenth graders conduct various activities utilizing the scientific method to formulate a hypothesis, conduct a controlled experiment, collect and analyze the data and communicate their results through a poster. They also identify...
Curated OER
Range, Cluster, Gap and Outliers
There are a number of activities here where learners collect and record data, as well as, activities where the likelihood of an event happening is calculated given the experimental probability. Young statisticians organize information...
Curated OER
Water Meter Reader
Junior high schoolers learn how to read a water meter, track their family water usage, and discuss the amount in class with other pupils. They will interpret real-world data and graph it. It is ideal for increasing awareness and...
Curated OER
Build a Bar Graph
Learners discover how to use bar graphs. They will gather and organize specific data in order to put it into a bar graph. Then they will answer several questions based on the information they have graphed.
Curated OER
Statistics and Probablility
Statistics and Probability are all about collecting, organizing, and interpreting data. Young learners use previously collected data and construct a picture graph of the data on poster board. This stellar lesson should lead to...


