Math Worksheets Land
Pie or Circle Graphs—Step-by-Step Lesson
How do you display data that you've collected in a pie chart? Follow a clear step-by-step guide to turning survey results into a visible format. It shows kids how to determine the percentage of the whole that each section represents.
Curated OER
Graphing Data
Seventh graders solve and graph 10 different problems that include various questions related to data on a graph. First, they create bar graphs to display the data given. Then, pupils determine the random sample of a population listing...
Curated OER
Using Graphical Displays to Depict Health Trends in America's Youth
Identify the different types of graphs and when they are used. Learners will research a specific health issue facing teens today. They then develop a survey, collect and analyze data and present their findings in class. This is a lesson...
Curated OER
Graphs
For beginners to picture graphs this is the perfect resource. They analyze two bar graphs that break down data visually so scholars can actually count the number in each column. For the first, they fill in how many of each type of pet is...
Curated OER
Data Analysis and Froot Loops
Use this probability and graphing lesson plan to have your learners work with a partner to make a necklace out of Froot Loops. They record the cereal colors randomly chosen and strung, graph their data, then use a ratio formula to...
Curated OER
When Will We Ever Use This? Predicting Using Graphs
Here are a set of graphing lessons that have a real-world business focus. Math skills include creating a scatter plot or line graph, fitting a line to a scatter plot, and making predictions. These lessons are aimed at an algebra 1 level...
Curated OER
Quantitative Data
In this quantitative data worksheet, pupils compute measures of central tendency, draw vertical line diagrams, and compare collected data. This 23-page worksheet contains approximately 100 multi-step problems. Explanations and examples...
College Board
So Much Data, So Little Time
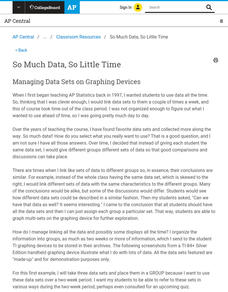
Organizing data in a statistics class is often a challenge. A veteran statistics teacher shares data organization tips in a lesson resource. The instructor shows how to group data to link to individual calculators in a more efficient...
Curated OER
Organizing Data
In this organizing data worksheet, 7th graders solve seven different types of problems related to data. They first identify the type of data as categorical, discrete or continuous from the information given. Then, students use Excel to...
Virginia Department of Education
Graphs
Examine different types of graphs as a means for analyzing data. Math scholars identify the type of graph from a series of data displays and then develop questions to match each one. Then, given a scatter plot of height versus age data,...
CK-12 Foundation
Types of Data Representation: Baby Due Date Histogram
Histograms are likely to give birth to a variety of conclusions. Given the likelihood a woman is to give birth after a certain number of weeks, pupils create a histogram. The scholars use the histogram to analyze the data and answer...
Illustrative Mathematics
Telling a Story With Graphs
Turn your algebra learners into meteorologists. Students are given three graphs that contain information about the weather in Santa Rosa, California during the month of February, 2012. Graph one shows temperatures, graph two displays the...
Curated OER
Position vs. Time Graphs of an Object at Rest
The presentation includes nine time vs. position graphs. The first three are meant to be used for teaching how to read them. The next three provide an opportunity for students to practice reading them, while the last three display the...
Curated OER
A Picture is Worth a Thousand Words: Introduction to Graphing
Young scholars practice graphing activities. In this graphing lesson, students discuss ways to collect data and complete survey activities. Young scholars visit a table and graphs website and then a create a graph website to practice...
K12 Reader
Showing Data on a Graph
Here's a worksheet that not only introduces kids to graphing, but also is designed as a reading comprehension activity. After reading the article about graphing, kids respond to a series of questions based on the article.
Willow Tree
Bar Graphs
Circles, lines, dots, boxes: graphs come in all shapes in sizes. Scholars learn how to make a bar graph using univariate data. They also analyze data using those bar graphs.
Fort Bend Independent School District
Data Analysis - AP Statistics
What better way to study survey design than to design your own survey! Bring a versatile data analysis project to your AP Statistics class, and encourage them to apply the practices from their instructions to a real-world survey project.
Shodor Education Foundation
Multi-Function Data Flyer
Explore different types of functions using an interactive lesson. Learners enter functions and view the accompanying graphs. They can choose to show key features or adjust the scale of the graph.
Shodor Education Foundation
Data Flyer
Fit functions to data by using an interactive app. Individuals plot a scatter plot and then fit lines of best fit and regression curves to the data. The use of an app gives learners the opportunity to try out different functions to see...
Curated OER
Charts and Graphs
Fifth graders interpret data into graphs and percentages. In this organizing data lesson, 5th graders discuss bar, circle and line graphs. Students complete bar graph and apply probability using the results.
National Security Agency
Line Graphs: Gone Graphing
Practice graphing and interpreting data on line graphs with 36 pages of math activities. With rationale, worksheets, and assessment suggestions, the resource is a great addition to any graphing unit.
Alabama Learning Exchange
Ice Cream Sundae Survey
Young scholars analyze data through graphs. They will complete a class survey on ice cream sundaes and tally and graph the responses. They then analyze the information from the class graph.
CK-12 Foundation
Double Bar Graphs: Favorite Cookies Chart
It's just the way the cookie crumbles. Using the data from a class poll, learners create a double bar graph showing favorite cookie types. The pupils compare favorites between boys and girls with the aid of their graphs, then they make...
CK-12 Foundation
Single Bar Graphs: Hockey Teams
Raise the bar for hockey fans. Using data about favorite hockey teams, pupils build a bar graph. They use the information from the graph to make comparisons and solve one- and two-step problems.


