Curated OER
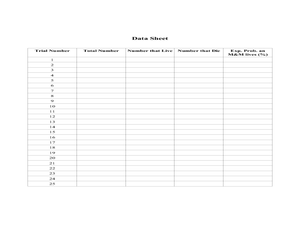
RIP M&M's
Learners solve theoretical probability problems. In this algebra lesson, students apply the concept of probabilities to solving real life scenarios. They collect data and graph it using experimental probability.
Curated OER
"M&Ms"® Candies Worksheet 1
In this math worksheet, students find the likelihood of different outcomes with the use of M and M's candy for the seven questions and fill in the graphic organizer.
Curated OER
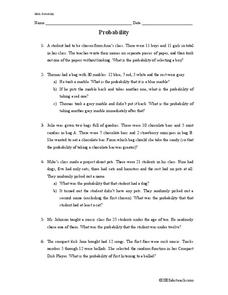
Probability
In this math worksheet, students take the time to attempt solving the six word problems using the concept of probability. The answers are on page 2.
Curated OER
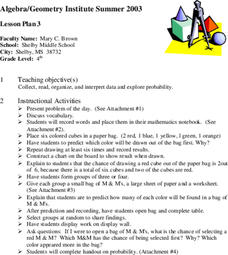
Exploring Probability
Fourth graders participate in a lesson that explores probability. They use candy and model cubes to experiment with different outcomes that can be charted if the students can proceed to the objective of the lesson. They discover how...
Curated OER
Mean, Median, Mode, etc.
Explore the concept of mean, median, and mode with pupils. They estimate the length of a string or the number of M&M's in a jar. Then find the mean, median, and mode of the class' estimates.
Curated OER
Probability or Ability?
Students toss candy and coins using their non-dominant hand while their partners records the results on a probability charts.
Curated OER
Probability or Ability?
Students use their non-dominant hand to catch candy which they tossed in the air. They estimate how many they catch in a second round. They record and determine how the probability changed the second time.
Primary Resources
Venn Diagrams
Combine your lessons on Venn diagrams, probability, and multiples with several activities. After picking seven cubes, learners note the number of cubes that are blue and mark them in a Venn diagram. The next assignments prompt them to do...
Curated OER
What's the Chance?
Young scholars study probability and statistics by conducting an experiment, recording their results, and sharing data with classmates.
Florida Center for Instructional Technology
Integrating Mathematics into Literature
You class will read Cucumber Soup by Vickie Leigh Krudwig as an anticipatory set for this lesson plan on ratios. They make models of the insects in the story and then use them as a source of data for this ratio and proportion lesson...
Curated OER
Candy Quakes
Eighth graders, using a candy bar, gum, and Twizzlers, demonstrate the effects of deformational forces on the earth's crust. They examine the processes of rock and fossil formation.
Curated OER
Probability or Ability?
Students fill in a probability chart while attempting to catch candy with their non-dominant hands. They replicate the activity with a coin.
Curated OER
The M&M's Brand Chocolate Candies Counting Book
First graders use estimation skills and gather data and record their findings
Curated OER
Probability Review
Students engage in a lesson that is concerned with the concepts related to probability. They review the key properties of statistics involved in the measurement of probability that includes mean, median, and mode. The lesson includes...
Curated OER
M&Ms Count and Crunch
Students practice skills involving statistics and probability by making predictions on number of each color candy in one pound bag of M&Ms. They record both guesses and actual quantities, calculate percentages, and create bar graphs...
Curated OER
Statistics and Probablility
Statistics and Probability are all about collecting, organizing, and interpreting data. Young learners use previously collected data and construct a picture graph of the data on poster board. This stellar lesson should lead to...
EngageNY
Using Expected Values to Compare Strategies
Discover how mathematics can be useful in comparing strategies. Scholars develop probability distributions for situations and calculate expected value. They use their results to identify the best strategy for the situation.
DiscoverE
Puff Mobiles
You've probably heard of solar-powered cars, but what about wind-powered cars? Scholars build cars that can travel at least six feet. They can only use their breath to move the car—so, obviously, a sail might be a good feature for the...
Curated OER
"Eggs-ploring" Math with Jellybeans
Learners work in pairs with a small bag of jellybeans to estimate the number of candies in their bags and then figure out how many groups of 10 jellybeans are contained in their bags. They then graph the information using a pictograph or...
NOAA
Make an Edible Coral Reef
Coral reefs are full of an abundance of life and color. Why not celebrate it with an edible coral reef? Learners and teachers alike use cake, icing, and candies to create a tasty version of a coral reef that's complete with colors,...
Curated OER
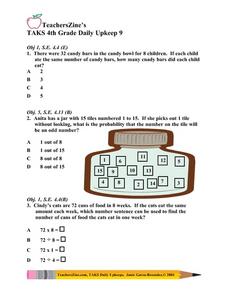
Daily Upkeep 9
For this math worksheet, 4th graders complete a set of word problems where they solve to find the difference number of candy bars. Then, they look at a jar with number tiles and select the probability that the number on the tile will be...
Alabama Learning Exchange
What's Your Favorite Chocolate Bar?
Young scholars complete a math survey. In this math graphs lesson plan, students complete a survey about their favorite candy bars. Young scholars create different kinds of graphs using Microsoft Excel to show their results.
Curated OER
Candy Quakes
Eighth graders use candy to show the effects of deformation forces on the earth's crust. In this rock and fossil formation instructional activity students construct models and simulations to describe and explain natural phenomena.
Curated OER
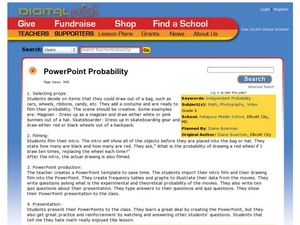
PowerPoint Probability
Sixth graders investigate film making by creating a video about probability. In this math visualization lesson, 6th graders create a presentation for their class demonstrating the probability of random events taking place in the real...


