Curated OER
Get Your Pupils Moving While Learning
Use these teaching strategies to get the wiggles out and keep the learning in!
Curated OER
Data Handling: Bus Charts
In this data display and analysis worksheet, learners study a bar graph that shows the number of people who ride the bus at different times of day. Students use the graph to solve 6 problems. Note: Bus times are shown in 24 hour clock time.
Curated OER
Charts and Graphs
Fifth graders interpret data into graphs and percentages. In this organizing data lesson, 5th graders discuss bar, circle and line graphs. Students complete bar graph and apply probability using the results.
Curated OER
Graphs and money
In this graphs and money worksheet, students complete word problems about different kinds of graphs and money in those graphs. Students complete 10 multiple choice problems.
Curated OER
My Test Book: Reading Graphs
In this online interactive math skills worksheet, students solve 10 multiple choice math problems that require them to read and interpret graphs. Students may view the correct answers.
Pennsylvania Department of Education
Use Order of Operations to Evaluate Expressions—No Grouping Symbols
Students identify and explain different types of data collection and graphs. In this graphs and data collection lesson, students record their observations of a variety of data collection tools and graphs displayed in the room. Students...
Math Drills
Valentine's Day Ordering and Comparing (B)
Discover this Valentine's Day-themed worksheet where young mathematicians answer word problems using data tables.
Curated OER
Transportation Math
Students explore the concept of exponents. In this exponents lesson, students evaluate various bases to powers. The bases to a given power are in the context of miles driven, stops on a route, and minutes spent in route. Students read...
Curated OER
My Test Book: Reading Graphs
In this online interactive math skills learning exercise, students solve 10 multiple choice math problems that require them to read and interpret graphs. Students may view the correct answers.
Curated OER
Apple Logic and Problem Solving
Students examine apple production in the United States. In this interdisciplinary lesson plan, students use problem solving strategies introduced to solve math problems associated with apple production in the United States. Student...
Curated OER
Use a Graph
In this math graphs worksheet, students use the data within the 'Make-Believe Animals' bar graph to answer the six word problems. Students learn to read the graph and use the numbers to solve the problems.
Alabama Learning Exchange
Tiger Math Graphing
Learners practice various skills using the book Tiger Math: Learning to Graph from a Baby Tiger. After listening to the story, they create a pictograph using data collected from the text. They also color a picture of a tiger, collect...
Curated OER
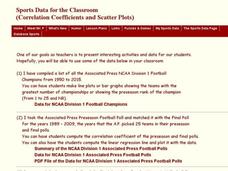
Sports Data for the Classroom
In this algebra worksheet,students rewrite word problems using algebraic expressions. They collect data and plot their findings on the graph and analyze it. There is an answer key for this worksheet.
Curated OER
Connecting With Coordinates
Play a coordinates game to encourage collaborative learning and grid use! Learners plot points on grids and play a game that challenges them to locate a specific point on a coordinate grid by using horizontal and vertical movements.
Curated OER
Organizing Data
In this organizing data instructional activity, 7th graders solve seven different types of problems related to data. They first identify the type of data as categorical, discrete or continuous from the information given. Then, students...
Mathematics Vision Project
Module 3: Polynomial Functions
An informative module highlights eight polynomial concepts. Learners work with polynomial functions, expressions, and equations through graphing, simplifying, and solving.
Bowland
Mystery Tours – Plan Your Tour
Everyone loves a vacation and a set of three activities has groups planning a tour of the U.K. using given distance, time, and price data. They solve a variety of problems related to the trip and produce a report on the success of the trip.
Los Angeles County Office of Education
Assessment For The California Mathematics Standards Grade 6
Test your scholars' knowledge of a multitude of concepts with an assessment aligned to the California math standards. Using the exam, class members show what they know about the four operations, positive and negative numbers, statistics...
Curated OER
Money Circulation: A Story of Trade and Commerce
Students are introduced to the meaning, symbolism, and value of the quarter. They determine the percentage of total monetary value held in quarters and graph the results. Students infer about the U.S. Mint's distrubution of coins. They...
Curated OER
Fractions: pie graphs, numbers, and bars
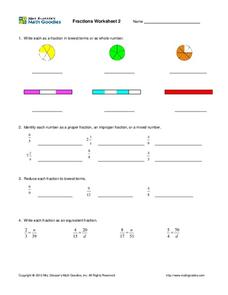
For this fraction worksheet, students complete fraction problems containing pie graphs, numbers, bars, proper fractions, lowest terms, and more. Students complete 19 problems.
Curated OER
Histograms
In this histograms activity, students solve 5 word problems based on a histogram of presidential ages at their inauguration. Next, students create a frequency table and a histogram based on a list of data which shows the average snowfall...
Curated OER
Box and Whiskers
Middle schoolers discover how to relate collected data with a box and whiskers graph in a number of formats. They collect, organize, create, and interpret a box and whiskers graph. Pupils interpret the difference between sets of data,...
Curated OER
The Gathering and Analysis of Data
Young mathematicians gather data on a topic, graph it in various forms, interpret the information, and write a summary of the data. They present their data and graphs to the class.
Curated OER
Tony's Spelling Troubles
Students are introduced to the given problem and describe in their own words the situation represented in a bar chart and tally chart. They then use a bar chart and tally chart to make sensible predictions.


