Statistics Education Web
Population Parameter with M-and-M's
Manufacturers' claims may or may not be accurate, so proceed with caution. Here pupils use statistics to investigate the M&M's company's claim about the percentage of each color of candy in their packaging. Through the activity,...
Curated OER
Statistical Process Control
Students brainstorm items they have that use memory and view Statistical Process Control PowerPoint presentation. They complete Statistical Process Control Simulation/experiment then find the average, range and standard deviation in...
Statistics Education Web
Who Sends the Most Text Messages?
The way you use statistics can tell different stories about the same set of data. Here, learners use sets of data to determine which person sends the most text messages. They use random sampling to collect their data and calculate a...
Shodor Education Foundation
Measures
Take a look at data from a statistical lens. An interactive allows pupils to enter data set, labeling the data including the units used. Manipulating the applet, learners select the statistics to calculate that include total, mean,...
Curated OER
Binomial Probability Distribution Section 5.4
In this Binomial Probability Distribution, students use the binomial probability formula to determine the success of a given probability. Using the given parameters, students write a probability equation and solve the problem. They...
College Board
Power in Tests of Significance
Test your knowledge of tests of significance. A curriculum model for AP® Statistics describes and defines power in terms of tests of significance. It also provides two classroom activities designed to investigate power and how it relates...
Curated OER
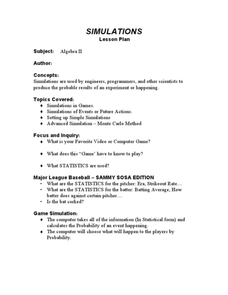
Simulation and Statistics
Students perform simulation of video games as they explore statistics. In this algebra lesson, students relate concepts of statistics and data collection to solve problems. They decide their next step based on the previous assessment of...
Curated OER
Bringing Climate Change Into the Classroom
Students investigate the greenhouse effect and examine the potential effects of climate change in the Arctic. They construct a mini-greenhouse and test its effect on temperature, analyze historical climate statistics, and conduct an...
Shodor Education Foundation
Rabbits and Wolves
A change in a parameter can end in overpopulation. The resources gives pupils the opportunity to control the parameters of rabbits and wolves in a natural setting. Using the set parameters, the simulation runs and displays the population...
Curated OER
Meaning of Power
Students graph exponential and power functions. In this statistics lesson, students test a specific hypotheses and draw conclusion. They use the graph of polynomials to test and draw their conclusions.
Curated OER
Strict Parents
Are your parents or guardians strict? That's an interesting question many of your pupils are probably interested in discussing. How do you design a study directed at your high schooler to gain insight into that question? How do you...
Curated OER
Data Analysis Using Technology
Analyze data using technology. Middle schoolers design data investigations, describe data, and draw their own conclusions. Then they select the best type of graph, graph and interpret the data, and look for patterns in trends. They also...
American Statistical Association
Confidence in Salaries in Petroleum Engineering
Just how confident can we be with statistics calculated from a sample? Learners take this into account as they look at data from a sample of petroleum engineer salaries. They analyze the effect sample size has on a margin of error and...
Statistics Education Web
What Percent of the Continental US is Within One Mile of a Road?
There are places in the US where a road cannot be found for miles! The lesson asks learners to use random longitude and latitude coordinates within the US to collect data. They then determine the sample proportion and confidence interval...
Shodor Education Foundation
Racing Game with One Die
Pupils roll a die to figure out which car advances on a race track. They determine the rules for each car moving forward and, given the statistics of the winner, compare if it matches their predictions.
Curated OER
Dating Practices
Students interpolate, extrapolate, and make predictions from given information. They present results and conclusions from given data using basic statistics. Pupils create a survey from a critical question and decide which sampling...
Curated OER
Exploring the Normal Curve Family
Young scholars find different characteristics of the bell curve. In this statistics lesson, students analyze a family for a specific characteristic. They identify the shape, center, spread and area as they analyze the characteristic of...
Curated OER
Power Metering Project
Students collect and analyze variable data and understand the concept of electrical power. In this energy lesson students use a spreadsheet to manage their data and create box plots.
Statistics Education Web
Consuming Cola
Caffeine affects your heart rate — or does it? Learners study experimental design while conducting their own experiment. They collect heart rate data after drinking a caffeinated beverage, create a box plot, and draw conclusions. They...
American Statistical Association
More Confidence in Salaries in Petroleum Engineering
Making inferences isn't an exact science. Using data about salaries, learners investigate the accuracy of their inferences. Their analyses includes simulations and randomization tests as well as population means.
Curated OER
State Database Lesson
Fifth graders create a database about the geography of the United States. The access to a computer is essential for this lesson plan. The outcome is that technology is used as a tool to measure student understanding of geographical...
American Statistical Association
Chocolicious
To understand how biased data is misleading, learners analyze survey data and graphical representations. They use that information to design their own plans to collect information on consumer thoughts about Chocolicious cereal.
Statistics Education Web
You Will Soon Analyze Categorical Data (Classifying Fortune Cookie Fortunes)
Would you rely on a fortune cookie for advice? The lesson first requires future statisticians to categorize 100 fortune cookie fortunes into four types: prophecy, advice, wisdom, and misc. The lesson goes on to have learners use...
Shodor Education Foundation
Plop It!
Build upon and stack up data to get the complete picture. Using the applet, pupils build bar graphs. As the bar graph builds, the interactive graphically displays the mean, median, and mode. Learners finish by exploring the changes in...


