Curated OER
Data Handling
For this data handling worksheet, 6th graders solve and complete 4 various types of problems. First, they draw a bar chart to represent the information provided in the table shown. Then, students show beneath the table how to work out...
Curated OER
Graph a Panther's Diet
Students examine the diet of panthers. In this interpreting data lesson plan, students collect data on the panther's diet and chart the data in bar and pie graphs.
Curated OER
Counting And Graphing
Students explore counting and graphing. For this math lesson plan, students practice counting from 1-25 and are exposed to two types of graphs: the pie graph and the bar graph. Students use Skittles to represent a variety of measurements.
Curated OER
Dealing With Data
Learners collect, organize, and display data using a bar graph, line graph, pie graph, or picture graph. They write a summary describing the data represented and compare the graph to another graph in the class.
Curated OER
Favorite Candy Bar Graph
Pupils decide on six different types of candy bars to include in a data collection activity. Working in small groups, they survey a target group in a set amount of time. They access a Internet based graphing tool to create a bar graph or...
Curated OER
Statistical Inquiry
In this statistical inquiry worksheet, students analyze and interpret a variety of diagrams such as a scatter plot, bar graph and pie charts. They create tables and other diagrams to support given data. This two-page worksheet contains 3...
Curated OER
Histograms and Statistical Graphics
In this statistics worksheet, students solve 6 data problems. They construct a histogram of given data, they create a frequency polygon, and a stem and leaf diagram. Students create a dot plot and a pie chart for given data sets. On the...
Curated OER
Colours of the Church Year
In this Colours of the Church Year activity, students use the chart 'Colours of the Church Year' to complete the pie-chart with the Church seasons and fill in the missing words.
Curated OER
7th Grade Math Circle Graphs
Seventh graders are able to develop (synthesis) pie graphs with the class and on their own. They are told that pie charts are a graphic representation of material that can be given in the form of parts of a whole by using...
Curated OER
What Are We Listening To?
Students gather data from a web site on number of music albums sold by genre for the last two years. They convert these figures to fractions, decimals, and percents, and display the results in bar graphs and pie charts.
Curated OER
Charting and Graphing Sales
Students analyze graphs, charts and tables. In this data analysis lesson, students practice creating and analyzing charts, graphs and tables corresponding to sales and surveys. This lesson uses data relevant to students and includes...
Curated OER
BUS: Farming: It's A Fact (Ag)
Learners create two different types of graphs from the information in the "Farm Facts" booklet (i.e., bar graph, pie chart, etc.). They calculate where your food dollars are spent (on and off farm).
K12 Reader
Displaying Data
It's important to learn how to display data to make the information easier for people to understand. A reading activity prompts kids to use context clues to answer five comprehension questions after reading several paragraphs about...
Student Handouts
The Eight Parts of Speech
Presented as eight slices of a whole pie, here is a nice graphic organizer for your young grammarians to complete and keep handy as they learn about the eight parts of speech: interjections, nouns, conjunctions, pronouns, adjectives,...
Curated OER
Comparing Fractions 8
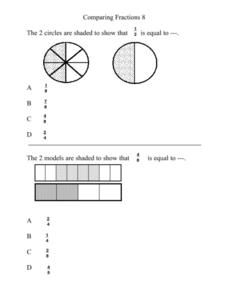
In this elementary math worksheet, 5th graders compare fractions using a pie chart and practice finding the values in the multiple choice format.
Curated OER
Problem-Solving Decisions: Choose the Operation: Problem Solving
In this math operations worksheet, students solve the word problem using the pie chart and following the steps of understand, plan, solve, and look back. Students then answer a final question by choosing the operation and solving.
Curated OER
Data Analysis
In these analyzing data worksheets, learners complete a table and a pie chart and calculate mean, median, mode, and range for sets of data.
Curated OER
My Science Box
Students investigate snails and their physical and behavioral characteristics. In this investigative lesson plan students create a pie chart to show the results of their findings.
Curated OER
Fill in the Graphs
In this graphing information activity worksheet, students use the 6 provided clues to appropriately fill in the blanks in a pie chart.
Curated OER
Data Handling
In this data handling worksheet, learners interpret data found in table, graphs and charts. They organize data and draw bar charts. This two-page worksheet contains 2 multi-step problems.
Willow Tree
Circle Graphs
Pie isn't just for eating! Scholars learn to create pie charts and circle graphs to represent data. Given raw data, learners determine the percent of the whole for each category and then figure out the degree of the circle that percent...
Virginia Department of Education
May I Have Fries with That?
Not all pie graphs are about pies. The class conducts a survey on favorite fast food categories in a lesson on data representation. Pupils use the results to create a circle graph.
Curated OER
Budget Making
After analyzing a pie graph of national spending, high schoolers express their opinions on priorities for national spending. They create a new bar graph and mail it to their congressional representative with recommendations about needed...
Curated OER
Science: Teddy Bear Nation
Young scholars sort teddy bears according to types and then graph the results. They each bring a bear to class and then discuss their similarities and differences. Once the bears have been sorted into groups according to size and color,...
Other popular searches
- Pie Charts and Graphs
- Interpreting Pie Charts
- Fraction Circles Pie Chart
- Circle Graphs Pie Charts
- Energy Pie Chart
- Reading a Pie Graph
- Creating a Pie Chart
- Bar Graphs, Pie Charts
- Pizza Pie Graph
- Nutrition Facts Pie Graph
- Pie Chart Activity
- M&m Pie Chart


