Types of Graphs Teacher Resources
Hi, What do you want to do?
Find Types of Graphs lesson plans and worksheets
Showing 33,896 resources
Curated OER
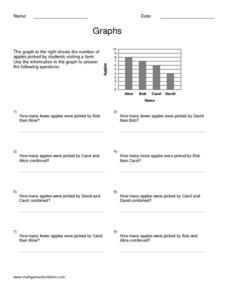
Graphs
In this graphing worksheet, students read information and study diagrams about graphing. Students complete 3 graphing activities.
Curated OER
Histograms and Bar Graphs
Young scholars examine the use of bar graphs and histograms. In this data representation lesson, students investigate the proper use of bar graphs and histograms to represent data. They learn the proper geometric definitions, experience...
Curated OER
Info. From a Graph
In this graphing instructional activity, students answer 13 questions about 3 graphs. Students determine the degree, roots, y-intercepts, inflection points, multiplicity, etc. of three different graphs.
Curated OER
Graphing It Out
Students create bar graphs. In this graphing lesson, students explore the concepts of net pay, gross pay, income and expenses. They create a bar graph to designate financial outlay during a specified period.
Curated OER
Circle Graphs
Fifth graders explore to find the central angle and percent. In this circle graph lesson, 5th graders use formulas to calculate the central angle and a protractor to create their graph. Students complete a graphing sheet for homework.
Math Mammoth
Bar Graphs 1
In this bar graph activity, learners organize data in a frequency table, then create a bar graph. They find the average of the data. This one-page activity contains two multi-step problems.
Curated OER
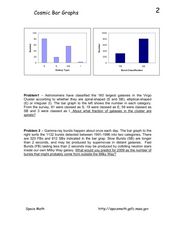
Cosmic Bar Graphs
In this cosmic bar graph activity, students solve 2 problems using given bar graphs that plot the number of galaxies vs. the galaxy type and the number of gamma-ray bursts vs. the burst classification. Students find the fraction of...
Curated OER
Making a Circle Graph of a Sample Budget
Students examine a sample budget and categorize the entries as a group. Then in small groups they convert budget category totals to percents and degrees to make a circle graph related to a sample budget.
Curated OER
7th Grade Math Circle Graphs
Seventh graders are able to develop (synthesis) pie graphs with the class and on their own. They are told that pie charts are a graphic representation of material that can be given in the form of parts of a whole by using...
Curated OER
Math Worksheet: Graphs Worksheet
In this math graphs worksheet, students study 5 large boxes filled with different geometric shapes. Students make a graph, tallying how many of each shape they see.
Curated OER
Graphs of Quadratic Functions
In this quadratic function worksheet, high schoolers solve and graph quadratic functions. Functions contain both positive and negative integers, fractions, and perfect squares. Graph paper is located below each equation. There are 36...
Curated OER
Graphing and Analyzing
In this graphing and analyzing worksheet, 9th graders first state if each graph represents a linear or nonlinear relationship. Second, they create a difference table for each set of data presented and determine whether it represents a...
Curated OER
Graphs
In this graphing learning exercise, 9th graders read one page of graphing examples and complete 8 exercise problems. Each problem involves graphing and coordinates.
Curated OER
A Line Graph of the Ocean Floor
Learners develop a spreadsheet and import the information into a line graph. In this spreadsheet and line graph activity, students develop a spreadsheet of ocean depths. They import the information into a word processed document. They...
Curated OER
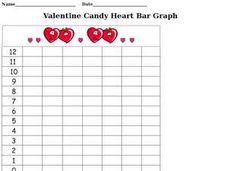
Valentine Candy Heart Bar Graph
In this Valentine candy heart bar graph worksheet, students complete a bar graph illustrating how many different colored candy hearts they received for Valentine's Day.
Curated OER
Class Birthday Graph
Students analyze the basics of an Excel spreadsheet. They highlight cells in a spreadsheet. They make a column graph. Students are introduced to X-axis and Y-axis. They play various address games on the spreadsheet.
Curated OER
Using a Hundreds Chart
Youngsters participate in three activities using the hundreds chart. They will choose numbers to add up to one hundred. Whoever gets the most combinations wins. Two variations of the game are supplied.
Utah Education Network (UEN)
Finding Slope of a Line from Graphs, Tables, and Ordered Pairs
Middle schoolers explore the concept of slope in numerous ways and start to look at simple linear equations. They describe the slope in a variety of ways such as the steepness of a line, developing a ratio, using graphs, using similar...
Mt. San Antonio Collage
Test 1: Functions and Their Graphs
Save the time creating an assessment because these function problems should do the trick. With 10 multi-part questions, they each focus on a different topic including radical, polynomial, linear and piecewise functions. The majority of...
Curated OER
Conic Sections: Hyperbolas 3
Continuing with the study of graphing hyperbolas, Sal shows an example of graphing a parabola that is centered at a point off the origin. By looking at the equation, first without shifting it, he helps listeners develop an intuitive...
Curated OER
Conic Sections: Hyperbolas 2
Here is an example in this video of graphing a hyperbola centered at the origin. First, Sal shows solving for the equations of the asymptotes and then shows how to determine the direction of the hyperbola. He takes the approach of not...
Scholastic
Study Jams! Circle Graph
Over a pizza dinner, RJ and Mia discuss how to use a circle or pie graph to represent data. After viewing, data analysts can use a Test Yourself feature to assess their own understanding. This is ideal for use in a flipped classroom lesson.
Curated OER
Graphing with Calculus
In a problem where you are not given the original function, but rather only three known points on the graph and a few additional pieces of information about when the first and second derivatives are positive or negative, Sal shows how...
Khan Academy
Identifying a Hyperbola From an Equation, Conic Sections, Algebra II
In this video, Sal shows again how to write an equation of a conic section in standard form and identify the conic section it represents. This time, his example is of a hyperbola (not centered at the origin), which he also graphs.
Other popular searches
- Tally Chart Graph
- Paper Pie Chart/graph
- Frog Chart Data Graph
- Heart Beats Graph Chart
- Chart and Graph Data
- Genetic Traits Chart Graph
- Graph and Chart Information
- Charts and Graph
- Gilded Age Chart Graph
- Chart Graph
- Line Graph T Chart
- Candy Heart Graph Chart


