Line Graph Teacher Resources
Find Line Graph lesson plans and worksheets
Showing 420 resources
Math Is Fun
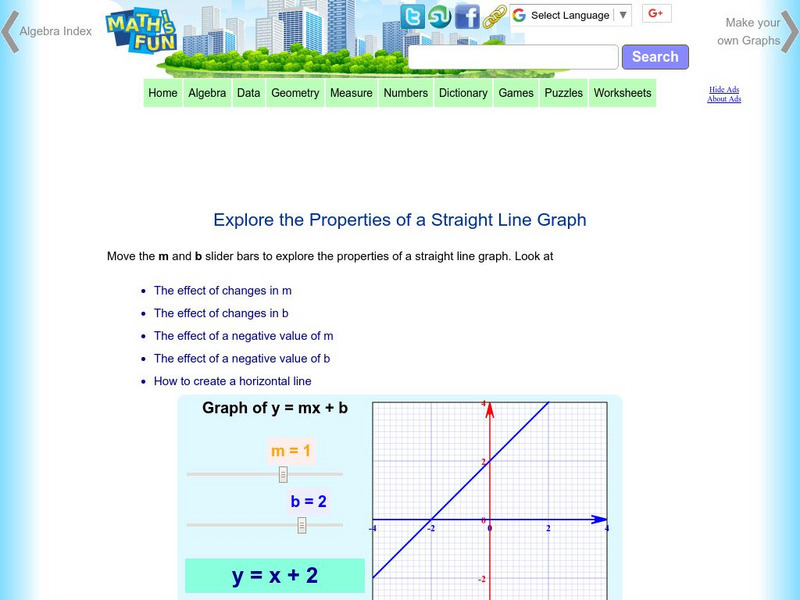
Math Is Fun: Explore the Properties of a Straight Line Graph
The interactive learning activity investigates the properties of a straight line graph.
Government of Alberta
Learn Alberta: Math Interactives: Exploring Data Display and Graphs
This multimedia Learn Alberta math resource focuses on graphing data. In the video portion, students will see how math is involved in the display of merchandise in stores. The accompanying interactive component provides an exploration...
Government of Alberta
Learn Alberta: Math Interactives: Exploring Election Data
Using actual Alberta provincial election results, students have the opportunity to interpret election data using a variety of graph types. Pictographs, line graphs, bar graphs, circle graphs, and data tables are covered in this...
University of Regina (Canada)
University of Regina: Math Central: Graphing Activities
Eighteen different graphing activities will teach students how to plot points, draw lines, compare graphs, and problem solve.
Alabama Learning Exchange
Alex: "Ridin' Along in My Automobile"
Students will research prices of used cars to discover how automobiles lose their value over time. Students will create a chart to record their information, use their chart to graph their data, and find measures of central tendency of...
Houghton Mifflin Harcourt
Houghton Mifflin Harcourt: Saxon Activity Center: Real World Investigation: Elevation Changes [Pdf]
Math and geography are the focus of this internet investigation. Learners must plan a road trip to several cities and plot the elevations of those cities using a line graph. Acrobat Reader required.
Texas Instruments
Texas Instruments: Mc Dougal Littell Middle School Math: Making Data Displays
Students will create data displays using a scatter plot and a line graph of the data and a circle graph of survey data.
Texas Instruments
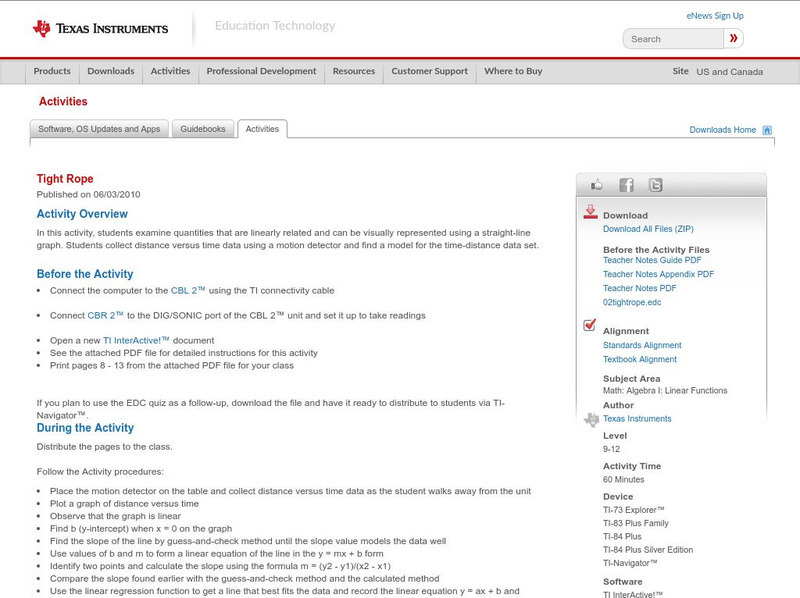
Texas Instruments: Tight Rope
In this activity, students examine quantities that are linearly related and can be visually represented using a straight-line graph. Students collect distance versus time data using a motion detector and find a model for the...
TeachEngineering
Teach Engineering: A Lego Introduction to Graphing
Students use a LEGO ball shooter to demonstrate and analyze the motion of a projectile through use of a line graph. This activity involves using a method of data organization and trend observation with respect to dynamic experimentation...
Texas Instruments
Texas Instruments: Key Curriculum Press Algebra: Project the Mandelbrot Set
Students will choose a small region on the boundary of the Mandelbrot Set and create a graph of that smaller region.
Other
Desmos: Water Line
In this real-world activity, students draw a graph of the height of water in a glass as water is being poured into it. They next make their own glass, create an accurate graph for it, and add it to a cupboard of glasses shared by...
The Franklin Institute
Frankin Institute Online: Group Graphing
This site from The Franklin Institute explores how to make a simple graph using a spreadsheet to portray survey data. It also gives a set of interesting sports-related web sites so that students can get statistical inforamtion.
Texas Instruments
Texas Instruments: Cabri Jr. The Equation of a L Ine
This activity uses Cabri Jr. to graph a line and show the equation of the line. The equations for oblique, horizontal and vertical lines are explored with emphasis on slope and y-intercept.
Texas Instruments
Texas Instruments: Linear Regression: Wing Span/height
Students take measurements of individual's wing span and height and create a coordinate graph. The activity should include at least three different grade levels. Students submit an equation through "Activity Center" and the class...
PBS
Pbs Teachers: Galileo's Battle for the Heavens Plotting Sun Spots
For this activity, learners follow in Galileo's footsteps as they examine the nature of sunspot cycles, define solar minimum and solar maximum, and graph data for a solar cycle. Then they will predict the next solar maximum and when the...
National Council of Teachers of Mathematics
The Math Forum: Chameleon Graphing: Coordinate Plane
Dive into this introduction to graphing in the coordinate plane, and meet a chameleon named Sam. Sam will help guide you through graphing points on a line, using negative numbers, and graphing points in the coordinate plane.
ClassFlow
Class Flow: Graphs
[Free Registration/Login Required] This flipchart presents bar and double bar graphs, line and double line graphs, pictographs, histograms, and circle graphs with review activities and web links for practice.
Oswego City School District
Regents Exam Prep Center: Categorizing Data
Three lessons on different types of data (qualitative, quantitative, univariate, bivariate, biased data) as well as a practice activity and teacher resource.
PBS
Pbs Mathline: Button, Button Lesson Plan [Pdf]
An integrated math and language arts lesson focusing on statistics. Students explore the concepts of estimation, data collection, data analysis, classification, graphing, and counting through the reading of the Button Box by Margarette...
abcteach
Abcteach: Fairy Tale Printouts: Abc teach.com
[Free Registration/Login Required] This fairy tale resource features activities, bar graphs, word searches, crossword puzzles and more. Teachers can print out many of these materials quickly and easily.
Ministry of Education and Universities of the Region of Murcia (Spain)
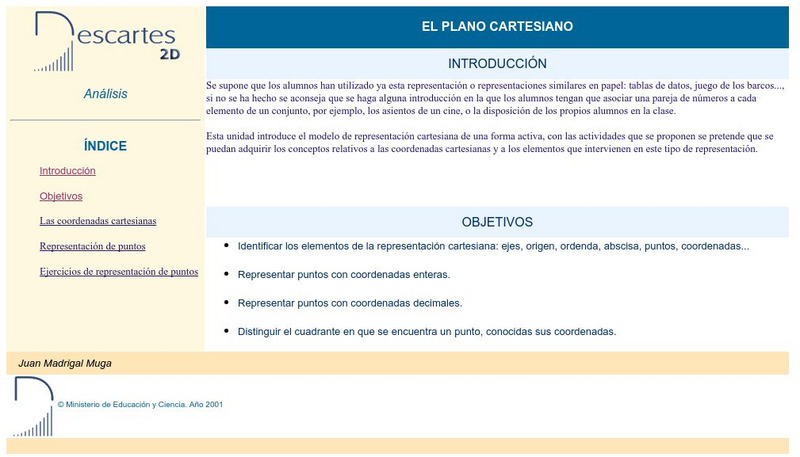
Ministerio De Educacion Y Ciencia: El Plano Cartesino
Interactive activities that will help you plot points on the Cartesian Coordinate Plane.
Ministry of Education and Universities of the Region of Murcia (Spain)
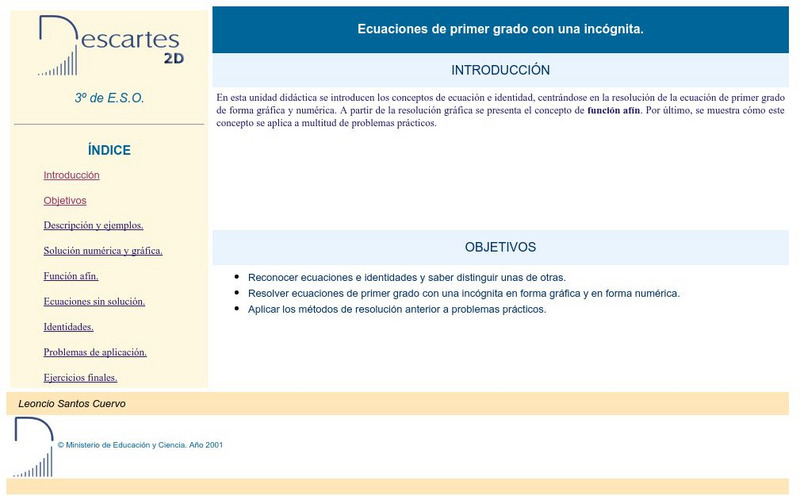
Ministerio De Educacion Y Ciencia: Ecuaciones De Primer Grado Con Una Incognita.
Interactive activities that will help you solve first degree equations with one unknown in graphical and numerical form.
TeachEngineering
Teach Engineering: Conduction, Convection, and Radiation
With the help of simple, teacher-led demonstration activities, students learn the basic concepts of heat transfer by means of conduction, convection, and radiation. Students then apply these concepts as they work in teams to solve two...
Texas Instruments
Texas Instruments: Classifying Quadrilaterals
Students will be sent ordered pairs through lists using the TI-Navigator. These pairs will then be graphed as a line graph and students will classify the shape of the quadrilateral and justify their choice.




![Houghton Mifflin Harcourt: Saxon Activity Center: Real World Investigation: Elevation Changes [Pdf] Activity Houghton Mifflin Harcourt: Saxon Activity Center: Real World Investigation: Elevation Changes [Pdf] Activity](https://d15y2dacu3jp90.cloudfront.net/images/attachment_defaults/resource/large/FPO-knovation.png)

