Graph Circle Teacher Resources
Hi, What do you want to do?
Find Graph Circle lesson plans and worksheets
Showing 172 resources
Curated OER
The Unit Circle
Young scholars relate the trigonometric functions to the coordinates of the unit circle. They classify trigonometric functions as odd or even. Students determine the signs of trigonometric functions in each quadrant. They are...
Curated OER
Delicious Graphing
Fourth graders sort trail mix by type and use that information to create different types of graphs for comparing.
Curated OER
What's Your Favorite Stuffed Animal?
Second graders gather information in a survey and interpret the results using a tally chart, a table, and a bar graph. They' present their results of the during the final group discussion. The subject of the survey is favorite stuffed...
Curated OER
Heads-Up Probability
Second graders use tree diagrams to predict the possible outcomes of coin tosses. The data they collect and graph also help them predict the likelihood of getting heads or tails when tossing coins the next time.
Curated OER
The Stock Exchange Phase I
Second graders select a stock and follow its ups and downs, using graphs to show its success.
Curated OER
We Are Having a Party! Part I
Second graders use data analysis skills in order to plan a class party. They graph possible times for the party noting the range for times. They discuss how mathematicians find and use the range to analyze data.
Curated OER
Parts of a Whole
Fourth graders explore fractions through the analysis of various paintings. They view and discuss paintings by Picasso and Seurat, discuss the fractional examples in the paintings, and create a bar graph.
Curated OER
Do You See What I See?
Students observe and describe different objects seen under a microscope and compare the individual perspectives of what was seen.
Curated OER
We Are Having a Party! Part II
Second graders, in groups, participate in a four-station rotation model to solve problems. They use coins and dice for stations one, two, and three.
Curated OER
Hyperbolas
Students find the center, foci, vertices, and asymptotes of hyperbolas. They graph hyperbolas and determine the equation of a hyperbola with a horizontal transverse axis. They derive general coordinates for the foci of a hyperbola with a...
Curated OER
Hyperbolas
Students locate and identify the center, foci, vertices, and asymptotes fo hyperbolas. They graph equations involving asymptotes and hyperbolas. Finally, students determine the equation of a hyperbola with a horizontal transverse axis.
Texas Instruments
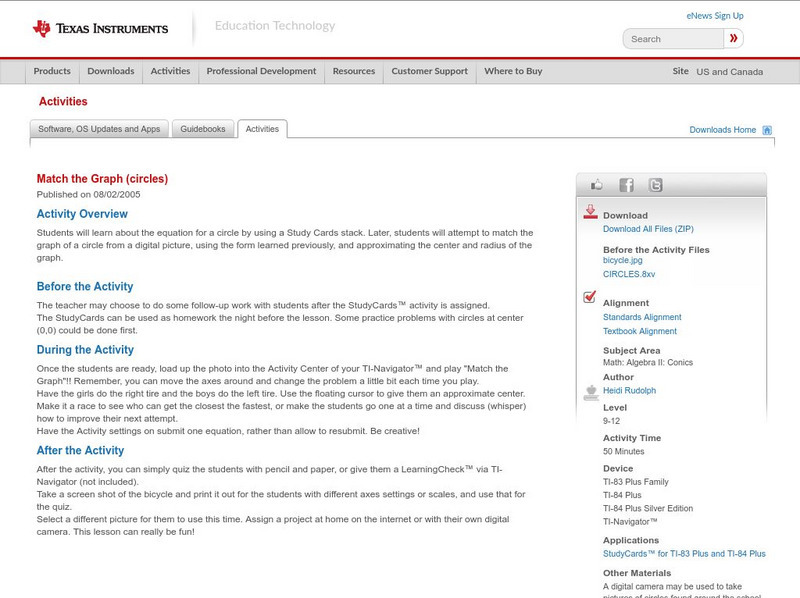
Texas Instruments: Match the Graph (Circles)
Students will learn about the equation for a circle by using a Study Cards stack. Later, students will attempt to match the graph of a circle from a digital picture, using the form learned previously, and approximating the center and...
Government of Alberta
Learn Alberta: Math Interactives: Exploring Election Data
Using actual Alberta provincial election results, students have the opportunity to interpret election data using a variety of graph types. Pictographs, line graphs, bar graphs, circle graphs, and data tables are covered in this...
Paul Dawkins
Paul's Online Notes: Algebra: Circles
Detailed math tutorial features notes and examples that illustrate graphing circles.
Math Graphs
Houghton Mifflin: Math Graphs: Circles of Curvature 1 [Pdf]
The handout examines the centers of curvature of a curve. Students use a compass to sketch the circles from a given curve and its evolute. The handout is available in PDF format.
Math Graphs
Houghton Mifflin: Math Graphs: Circles of Curvature 2 [Pdf]
The handout examines the centers of curvature of a curve. Students use a compass to sketch the circles from a given curve and its evolute. The handout is available in PDF format.
Oswego City School District
Regents Exam Prep Center: Circles
Use this lesson, practice quiz, and activity when planning classroom instruction on graphs and equations of circles.
Government of Alberta
Learn Alberta: Math Interactives: Exploring Data Display and Graphs
This multimedia Learn Alberta math resource focuses on graphing data. In the video portion, students will see how math is involved in the display of merchandise in stores. The accompanying interactive component provides an exploration...
US Department of Education
National Center for Education Statistics: Create a Graph Tutorial
This tutorial walks students through how to create different types of graphs using the Create a Graph tool available on the website. Covers bar graphs, line graphs, pie charts, area graphs, scatter plots, and dependent and independent...
Alabama Learning Exchange
Alex: Great Golly Graphs
This lesson plan asks young scholars to create a survey project including graphs, questions, tables, and data analysis. It gives an assessment and ideas for remediation and extension as well as ways to manage behavior problems and...
CK-12 Foundation
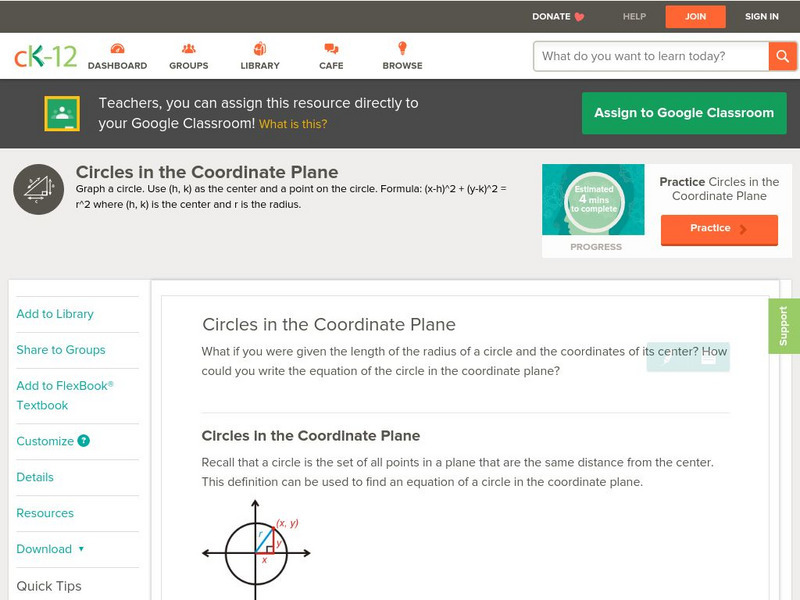
Ck 12: Geometry: Circles in the Coordinate Plane
[Free Registration/Login may be required to access all resource tools.] This concept teaches students how to graph circles and find the standard equations of circles. Students examine guided notes, review guided practice, watch...
ClassFlow
Class Flow: Data Analysis Using Graphing
[Free Registration/Login Required] This flipchart allows students to analyze data using appropriate graphs, including pictographs, histograms, bar graphs, line graphs, circle graphs, and line plots introduced earlier, and using...
PBS
Pbs Kids Afterschool Adventure!: Operation: Data Saves the Day Activity Plan
Data comes to the rescue! Children will collect, analyze, and represent data as they try to dodge a series of catastrophes faced by characters from their favorite PBS Kids shows.


