Descriptive Statistics Teacher Resources
Find Descriptive Statistics lesson plans and worksheets
Showing 591 resources
Curated OER
Coin Shake-Up
Students discuss problem and take turns in pairs, one tossing the coins while the other guesses whether the coins land with the same side up or different sides up. They record the results of each guess as same or different.
Curated OER
Richard's Dice
Learners problem solve logic problems. They complete a worksheet using dice as a manipulative. They decide on a problem solving strategy, solve the problem, and write up the solution.
Curated OER
Drive-Thru Nutrition
High schoolers research fat and calorie content of various food items at 12 popular fast-food restaurants. They compare the foods and create a day's worth of healthy menus using food from those restaurants.
Curated OER
What Toothpaste Do You Use?
Students collect data about their favorite toothpaste and then graph the results of that data. They survey 15 of their friends to determine which toothpaste they use the most often and then color the graph to reflect the survey results.
Curated OER
Arbor Day Across the United States
Pupils perform research about hardiness zones used to guide planting. They read a hardiness zone color-key map and create their own color-key maps to show when different states celebrate Arbor Day.
Curated OER
Persuasion
Young scholars explore the characteristics of a persuasive letter. They label each characteristic and they create a persuasive letter using the correct business letter format. Students recommend a school rule or change of a rule and...
Curated OER
A Change of Climate
Students research various sources to learn about global warming. They then create a multimedia presentation about global warming. They take a stance on the issue and present that as well.
Curated OER
Inventors Timelines
Students create a class timeline using the patent year for their selected inventor or invention. Using a piece of yarn, they physically create a timeline, and create and answer math word problems using the years from the timeline.
Curated OER
Virtual Field Trip
Pupils calculate gasoline cost per mile on a virtual field trip. They calculate the gasoline costs and travel time for each of the 2 routes, and record on a data sheet. They use Excel to create data tables for mileage, gasoline costs,...
Curated OER
Earthquakes of the World
Students observe data of earthquakes with a magnitude of 7 or greater on the Richter scale from 1900-1989. The data is evaluated and assumptions are made about the interpretation.
Curated OER
Introduction to Economics
Students develop the concept of supply and demand. In this economics lesson, students listen to a lecture and take notes on supply and demand. Students create a coherent set of notes about supply and demand.
Curated OER
Topic 5: Running the Business
Students explore the concept of running a business. In this running a business lesson, students put their plan of action into practice. Students market a product and try to maximize profit.
Curated OER
Topic 6: Evaluating and Presenting Results
Learners construct spreadsheets from raw data. In this spreadsheet construction lesson, students compile data into Microsoft Excel. Learners familiarize themselves with entering and presenting data in a spreadsheet.
Curated OER
Water: to the Last Drop
Students research how water played an important role in US history. In this social studies lesson, students make a mock newscast from one of the events they researched. They present their newscast to the class.
Calculator Soup
Calculator Soup: Descriptive Statistics Calculator
This is a statistics calculator; enter a data set and hit calculate. Descriptive statistics summarize certain aspects of a data set or a population using numeric calculations. Examples of descriptive statistics include: mean, average,...
Texas Education Agency
Texas Gateway: Descriptive Statistics: Bringing It Together: Homework
In this set of homework exercises, students apply what they have learned about descriptive statistics.
Texas Education Agency
Texas Gateway: Tea Statistics: Descriptive Statistics: Introduction
In these exercises to introduce descriptive statistics, students will construct a histogram and a box plot, calculate univariate statistics, and interpret the data in the graphs.
CK-12 Foundation
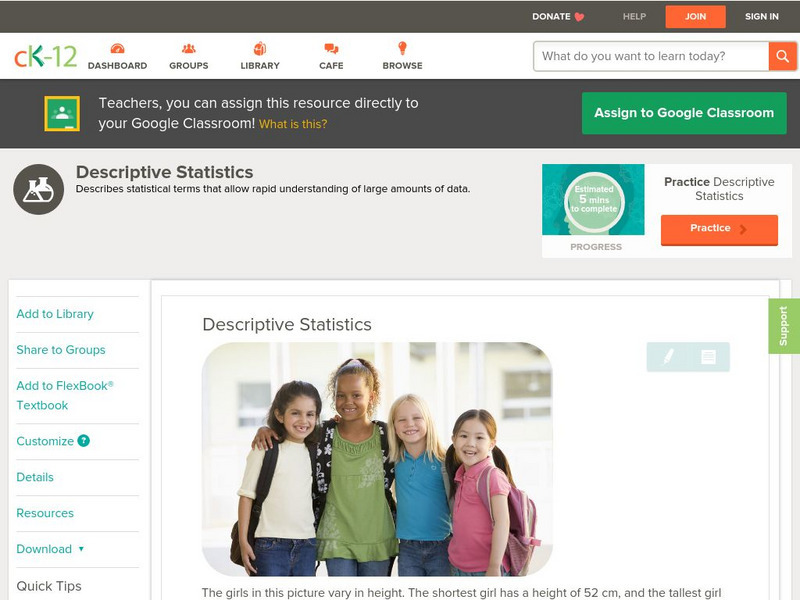
Ck 12: Physical Science: Descriptive Statistics
[Free Registration/Login may be required to access all resource tools.] Explains descriptive statistics (mean, median, mode, range).
Vision Learning
Visionlearning: Statistics: Using Mean, Median, and Standard Deviation
An introduction to recognizing trends and relationships in data through descriptive statistics.
Science Education Resource Center at Carleton College
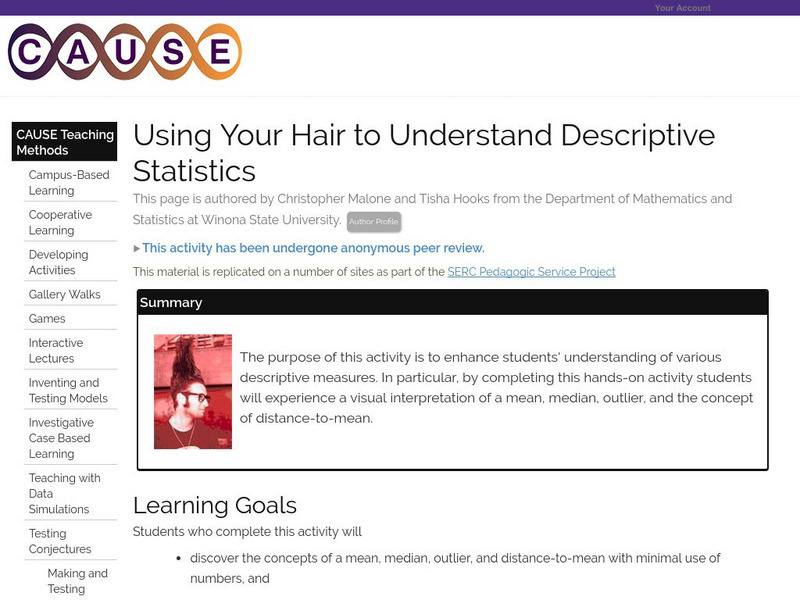
Serc: Using Your Hair to Understand Descriptive Statistics
Enhance students' understanding of various descriptive measures with a visual interpretation of a mean, median, outlier, and the concept of distance-to-mean.
Other
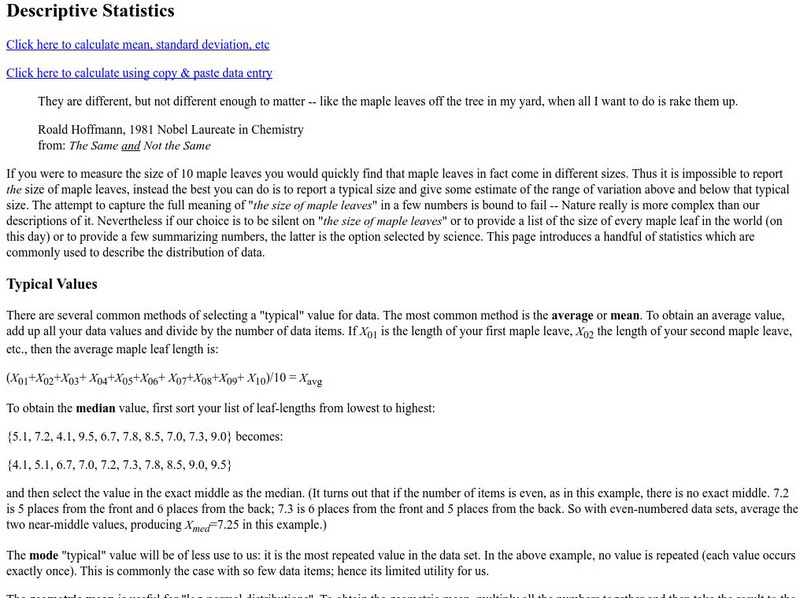
Descriptive Statistics
Very complete explanation of mean, standard deviation, etc. including an online calcluator for these statistics.
Other
42e Xplore: Statistics and Probability
An extensive collection of links on statistics and probability can be found here! Discussions ranging from the basics of stats through more complex data analysis. Topics are broken down into sections for teachers, students, WebQuest...
Wolfram Research
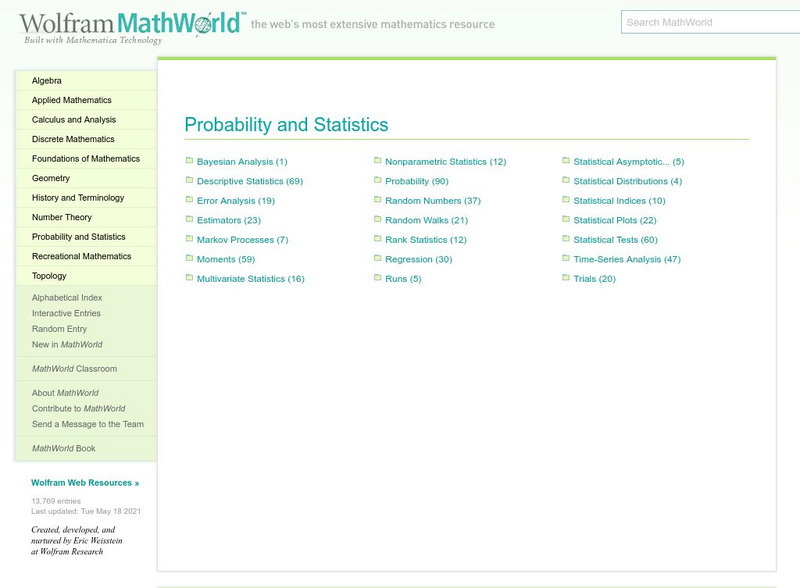
Wolfram Math World: Probability and Statistics
This is a resource for many topics in probability and statistics. Click on the topic of your choice for an explanation. The sites you will be linked to are quite extensive. A degree of higher-level math is necessary for understanding...
University of Illinois
University of Illinois: Introduction to Descriptive Statistics
A series of explanations of statistics terms based on the statistics from a dice game.


