Charts and Graphs Teacher Resources
Find Charts and Graphs lesson plans and worksheets
Showing 610 resources
Curated OER
Aerosol Lesson: Science - Graphing SAGE II Data
Students examine and plot atmospheric data on bar graphs.
Curated OER
Empty Oceans
In groups of four, pupils brainstorm about seafood. They view the Monterey Bay Aquarium Seafood Watch website to examine the problems caused by the seafood industry. Learners are then brought back together to discuss what they...
Curated OER
How Do I Get There? Planning a Safe Route to School
One much-needed skill for young learners is direction giving. Have your class plan and draw a safe route for them to travel from home to school. They will also draw places and items that are in between home and school in order to build a...
Curated OER
Graphing Pendulum Results
Sixth graders set up a pendulum experiment deciding which variable to manipulate (length of string or weight on the string). They create a hypothesis, collect necessary equipment, and write out each step of their experiment. They then...
Curated OER
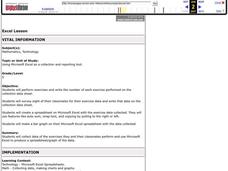
Excel Lesson
Fifth graders will perform exercises and write the number of each exercise performed on the collection data sheet. They survey eight of their classmates for their exercise data and write that data on the collection data sheet. They then...
Curated OER
Death by Particles
Emerging epidemiologists define relative risk and read an article about the effect of particulate pollution on the cardiovascular health of women. They record the relative risk values, graph them, and answer analysis questions. This is a...
Curated OER
MAISA and the REMC Association of Michigan
Students complete online research to study geography's impact on weather. In this geography and weather instructional activity, students research weather in their city for ten days using an online website. Students bookmark the site,...
Curated OER
Can You Count on Cans?
How can a canned food drive be connected to math? It's as simple as counting and organizing the cans! Children demonstrate their ability to sort non-perishable foods into categories that include soup cans, vegetable cans, boxed items,...
Curated OER
What do Maps Show: How to Read a Topographic Map
Young scholars identify the characteristics of topographical maps. Using examples, they practice reading them and describing the information they gather from them. They also discover how to use the website from the U.S. Geological Survey.
Curated OER
A Document-Based Essay on Korean Social Change
Students interpret historical evidence presented in primary resources. In this Korean history lesson, students examine the provided information on life in Korea. Students respond to the questions that accompany each source. Students then...
Curated OER
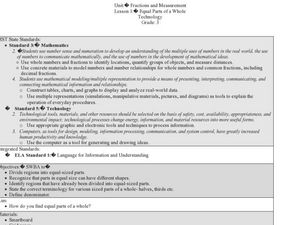
Fractions and Measurement
Using a Smart Board, or a plain ol' white board or chalkboard, the teacher pulls up a grid and demonstrates how squares and rectangles can be divided up into equal parts. The class will get their own graph paper to draw shapes and divide...
Curated OER
Law of Large Numbers - Hospital
Students explore concepts of probability and independent events. They develop a formula for deviation percentage.
Curated OER
The Mysteries of El Nino: How Much do We Really Know?
Seventh graders investigate the causes and effects of El Nino and explore its global impact on weather related occurrences through this series of activities.
Curated OER
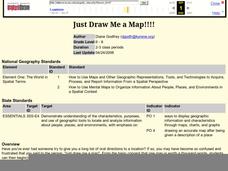
Just Draw Me a Map!!!!
Students draw a map to give directions to someone rather then give them too many relative locations.
Curated OER
Cartogram of the Great Compromise
Students create cartograms of populations during 1790.
Curated OER
Your Day as a Cycle
Fourth graders examine a variety of cycles. They take a look at life cycles of plants and animals, the cycle of the moon and tides, and other sequences of events in their daily lives. An interesting part of the lesson is how kids keep...
Curated OER
Glided Age
Eleventh graders will participate to brainstorm on the overhead, characteristics of an "irresponsible" adult and 5 of a "responsible" one? How do these differ if we apply these to businesses? Working in partners--Create a Code of Ethics...
Curated OER
Sound
Third graders explore sound. They describe sounds in terms of their properties and explain how sounds are made. Students discuss how various sounds sound to their ears and how sound travels in waves.
Curated OER
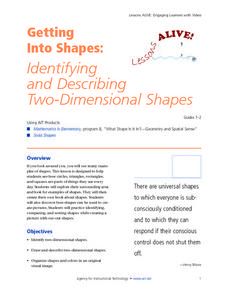
Getting Into Shapes: Identifying and Describing Two-Dimensional Shapes
Young scholars examine their classroom to find examples of various types of shapes. After identifying and describing the various shapes, they draw as many as they can on a piece of paper. They organize them into an image based on their...
Curated OER
Telling Time to 5 Minutes
In this second grade lesson your class will practice telling time. The goal is to tell time to five minutes using an analog clock. Your young students count by 5 minute intervals and discuss elapsed time.
Curated OER
"Can Do!" Reading, Writing, and Understanding the Art of Technical Writing
Technical and informational writing is the most common type of writing that students will encounter. Using this SMART board activity, teach your 10th graders the four different types of technical writing. They can then practice following...
Achievement Strategies
CCSS Unit Design Template for Art
Art classes, like any lab class, require extensive preplanning and set-up time. Use this planning template in the quiet before the storm to identify the equipment and materials that will be needed, the procedures and processes...
Curated OER
Graphing
Students collect data and graph their results, then analyze the graphs. In this geometry activity, students examine slopes and their graphs and discuss the relationship between the lines and the slopes.
Other popular searches
- Pie Charts and Graphs
- Reading Charts and Graphs
- Behavior Charts and Graphs
- Charts and Graphs Candy
- Interpret Charts and Graphs
- Charts and Graphs Christmas
- Charts and Graphs Math
- Analyzing Charts and Graphs
- Tables, Charts and Graphs
- Charts and Graphs Europe
- Using Charts and Graphs
- Bar Graphs and Charts


