Corbett Maths
Drawing Graphs Using Xy Tables
What does a linear equation look like in a table? A video lesson practices graphing linear equations by making an input-output table. The instructor emphasizes the pattern in the table and relates that to the graph of the function.
Khan Academy
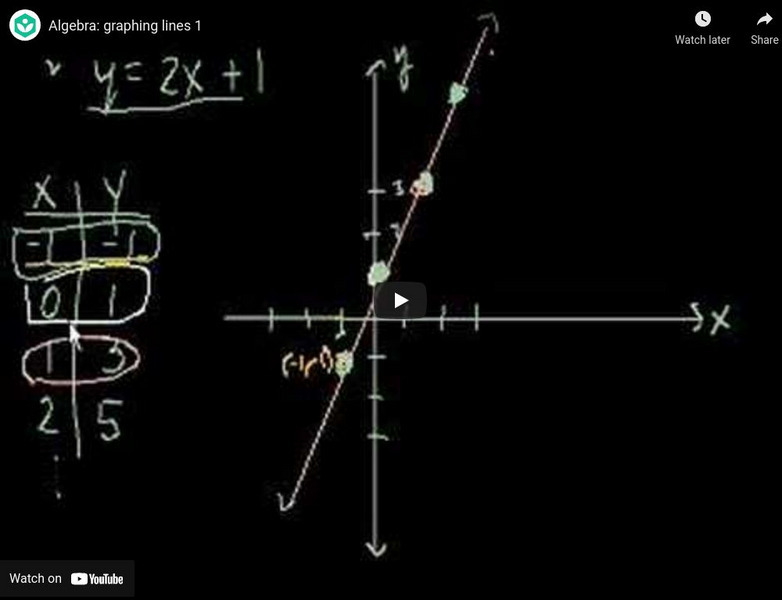
Khan Academy: Algebra: Algebra: Graphing Lines 1
This video demonstrates how to make a table of x and y values in order to graph the equation of a line. [9:50]
Khan Academy
Khan Academy: Algebra: Graphs of Linear Equations
This video demonstrates how to graph a linear equation by creating a table of x, y values to use as coordinates for the graph of the line. The second example demonstrates how to take a word problem and create a table of values to graph...
Khan Academy
Khan Academy: Application Problem With Graph
This video shows how to take a given equation in a word problem and create a table of (x,y) values that can be used to graph the equation. Once the table is graphed it demonstrates how to estimate a specific value on the graph in order...
Khan Academy
Khan Academy: Algebra: Two Variable Linear Equations (1)
This video shows how to graph a linear equation by creating a table of (x,y) values that satisfy the equation and then plotting these values on a coordinate plane. Practice problems available. [4:29]


