Curated OER
Interesting Properties of Cubic Functions to Discover Graphically or Numerically
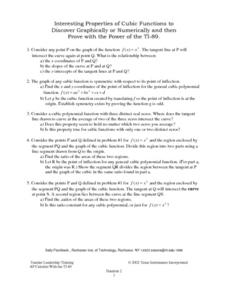
Learners investigate the slope of a cubic function. They find the tangent line of the cubic function at point P, and discuss the relationship between point P and point Q, the point the tangent line intersects the cubic function. ...
Curated OER
Writing Linear Equations in Different Forms
This worksheet is jam-packed with linear equations! Learners write equations in slope-intercept form and standard form. Horizontal and vertical lines are included, as well as graphs for several of the problems. A great way to...
Curated OER
Writing Linear Equations in Different Forms
Can your class write linear equations three different ways? Here is a study guide that includes slope-intercept, standard, and point-slope forms. Learners are given the slope and a point on the line, or two points and are asked to write...
Inside Mathematics
Squares and Circles
It's all about lines when going around. Pupils graph the relationship between the length of a side of a square and its perimeter. Class members explain the origin in context of the side length and perimeter. They compare the graph to the...
Curated OER
Practice Problems for Linear Equations and Graphs
A worksheet that could also be used as a quiz presents students with 20 linear equations. They graph, solve for the slope, and intercepts of 8 equations. Students solve for the equation of a line, passing through given points for 6 sets...
Curated OER
Graphing Polynomials
In this polynomials worksheet, 9th graders solve and complete 3 different problems. First, they illustrate the x is equal to a given number of a function and determine its multiplicity. Then, students factor the function completely and...
Curated OER
Linear Functions
Students solve, identify and define linear equations. For this algebra lesson, students calculate the slope and y-intercept of a line. They graph the line given two points and the slope.
Curated OER
Graphing Linear Equations
In this linear equations worksheet, students graph linear equations on a coordinate plane. They identify the slope and the y-intercept. This five-page worksheet contains approximately 36 problems.
Curated OER
Graphing Linear Equations Using Data Tables
Students review the Cartesian plane and the process of plotting points. In groups, students create tables, identify the slope and y-intercept, and graph the equation. Afterward, students perform the same process, only, individually. As a...
Curated OER
Linear Equations Data Tables
Students graph linear equations on a Cartesian plane. After describing data tables and their use, students explore how the information from a table can be used to create a line graph. They discuss reasons for plotting a minimum of...
Curated OER
Write the Equation of a Line Given the Slope and a Point
Students write the equation of a line given the slope and y-intercept. In this algebra instructional activity, students are given a point a the line and the slope of the line and are asked to write an equation of the line. They relate...
Math Worksheet Center
Linear Quadratic Systems
In this linear quadratic system worksheet, learners explore a system with a linear and a quadratic equation. With the given equations, students graph the parabola. They identify the axis of symmetry, the slope, points of intersection,...
Curated OER
Chapter 10 - Objective 6.1 Graph
In this graphing worksheet, students solve linear and parabolic equations and graph equations on a coordinate plane. They use the discriminant to determine the number of x-intercepts of a parabola. This one-page worksheet contains ten...
Curated OER
Extra Problems - Week 13 (Functions)
In this function learning exercise, students complete a variety of problems. They explore logarithms, find the y-intercept, identify the y-intercept, and complete distance problems. This seven-page learning exercise contains 30 problems.
Curated OER
Graphing Linear Equations
Students graph linear equations. In this algebra lesson plan, students perform transformation on linear equations. They identify the slope and y-intercept of each line.
Curated OER
Properties of Logarithms
Students explore the concept of logarithms. In this logarithms activity, students graph logarithms on their Ti-Nspire calculator. Students describe the shapes of their graphs by identifying slope, y-intercepts, and...
Curated OER
Exponential Equations and Functions
In this college level Pre-Calculus worksheet, students solve problems involving exponential functions. Students determine the domain, range, y-intercept and asymptotes of exponential functions. The three page worksheet contains...
Curated OER
What's Its Slope
Students identify the slope of a lines.In this algebra lesson, students define the meaning of slope and write an equation given the slope. They graph linear functions using the slope and y-intercept.
Curated OER
Parabola
In this parabolas worksheet, 10th graders solve and graph 12 different problems related to various types of parabolas. First, they determine the vertex and the y-intercept based on the graph illustrated for each. Then, students write a...
Mathematics Assessment Project
Sorting Equations of Circles 2
How much can you tell about a circle from its equation? This detailed lesson plan focuses on connecting equations and graphs of circles. Learners use equations to identify x- and y-intercepts, centers, and radii of circles. They also...
Ed Migliore
Linear Equations in Two Variables
This traditional textbook style unit includes vocabulary, a direct explanation section, examples, practice problems that directly line up with the explanations and examples, and a unit summary review and practice problems. Learners get...
Virginia Department of Education
Functions 2
Demonstrate linear and quadratic functions through contextual modeling. Young mathematicians explore both types of functions by analyzing their key features. They then relate these key features to the contextual relationship the function...
West Contra Costa Unified School District
Key Features of Graphs
The key is ... After a day of instruction on key features of graphs, groups create a poster and presentation on the key features of their given function graph. The resource provides an extension activity of "telephone" using...
Illustrative Mathematics
Graphs of Quadratic Functions
The equations look different, but their graphs are the same. How can that be? This activity leads your mathematicians in an exploration of three different forms of the same quadratic function. After comparing the equations, their graphs,...
Other popular searches
- Finding X and Y Intercepts
- Graph Using X and Y Intercepts
- Finding the X and Y Intercepts
- X Y Intercepts Graphing
- Y Intercept and X Intercept
- Graph X and Y Intercepts
- Graphing X and Y Intercepts
- Y X Intercepts


