Curated OER
Reading a Graph: Azimuth Range vs. Day in Barrow Alaska
Learners practice reading a graph while doing story problems. They determine the x and y intercepts and calculate the slope. They also practice writing linear equations.
Virginia Department of Education
Transformation Investigation
Graph it! Investigate transformations with a graphing calculator. Pupils graph sets of linear functions on the same set of axes. They determine how changes in the equation of a linear function result in changes in the graph.
Curated OER
Equations and Inequalities
Students in a college algebra class use graphs to solve inequalities. Using the coordinate graphing system, they represent the relationship between x and y intercepts. They practice solving equations with complex numbers and locate...
Curated OER
Quadratic Functions
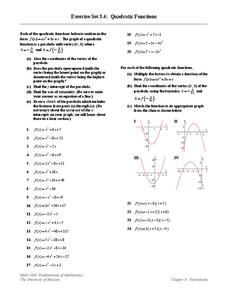
For this graphing quadratic equations worksheet, students find the vertex and graph the parabola for 24 quadratic equations. The final four are factored into binomials to increase accuracy of the x intercepts.
Curated OER
Expressing Geometric Properties with Equations
Algebra and geometry are not interchangeable. Demonstrate why not with a series of problems that deal with the equations of circles and equations of lines that meet specific criteria.
Curated OER
The X Factor - Trinomials and Algebra Tiles
Learners use algebra tiles to identify the binomial factors and the graphing calculator to verify the result. In addition, they will identify the x-intercepts and y-intercepts of each trinomial function and explore relationships between...
Curated OER
Algebra: Linear Equations
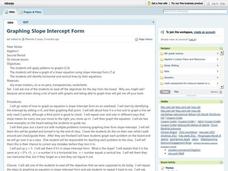
Students draw graphs of linear equations using the slope intercept form. Upon completion of various problems, students record their answers on the board and explain the solutions to classmates. Students take a test over the material...
Curated OER
Math Worksheet: Graphs of Rations Functions (2)
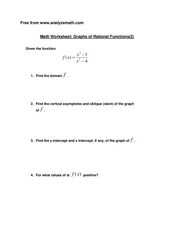
In this Algebra II worksheet, 11th graders examine a rational function as they determine the domain, vertical asymptotes, x- and y-intercepts and graph the function. The two page worksheet contains five problems that relate to the...
Curated OER
Graphing Review
Students review the principles of graphing linear functions. They discuss plotting points on a coordinate plane, solving using a table, and then graphing. Students solve problems and determine the slope of the line, y-intercept and if...
Curated OER
Linear Equations
In this linear equations worksheet, 9th graders solve and complete 7 different problems that include a number of linear equations. First, they determine the slope given the points and then write an equation in slope-intercept form. Then,...
Curated OER
Linear and Quadratic Functions
In this algebra worksheet, 11th graders solve quadratic functions using the quadratic formula. They take the square roots of both side of each equation then graph both the linear and quadratic functions. There are a total of 84 problems...
Curated OER
Graphing Rational Functions
In this algebra worksheet, 11th graders graph rational functions. They identify the asymptote, discontinuity, holes and vertex. There are 14 questions with an answer key.
Curated OER
Graphing Radical Functions-A Graphic Introduction
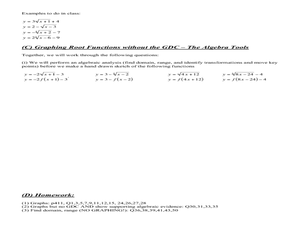
In this Algebra II worksheet, 11th graders graph root functions and analyze the domain, range, intercepts, maximum and minimum values, and end behavior. students use that information to transform the graphs of root...
Curated OER
Quadratic Rules and Graphs
Students identify the properties of quadratic equations. In this algebra lesson, students find the vertex and intercepts of a parabola. They factor quadratics and identify the zeros of the equations.
Curated OER
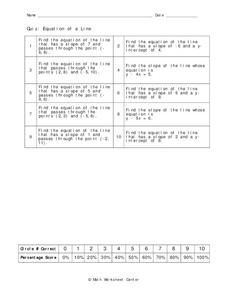
Equation of a Line
For this equation of a line worksheet, 9th graders solve 10 different problems that include the equation of a line. First, they determine the equation of a line that has a given slope and passes through a given point on a graph. Then,...
Curated OER
Graphs of the Sine and Cosine Function
For this college level Pre-Calculus worksheet, students investigate the graphs of the sine and cosine functions. The six page worksheet contains seventy-eight problems. Solutions are not provided.
Curated OER
Investigating Linear Equations Using Graphing Calculator
Students investigate linear equations using the Ti-Calculator. For this algebra lesson, students graph lines and identify the different quadrants on a coordinate plane. They identify ordered pairs used to plot lines.
Curated OER
Proportionality in Tables, Graphs, and Equations
Students create different methods to analyze their data. In this algebra instructional activity, students differentiate between proportion and non-proportional graph. They use the TI-Navigator to create the graphs and move them around to...
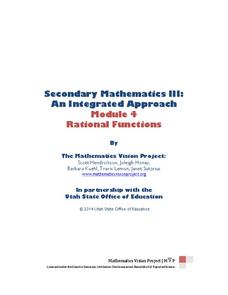
Mathematics Vision Project
Module 4: Rational Functions
Time to study the most sensible function — rational functions! The seven-lesson unit develops the concept of a rational function through a connection to rational numbers and fractions. Scholars graph functions, solve equations, and...
Virginia Department of Education
Slope-2-Slope
Pupils build on previous experience with slope to investigate positive, negative, zero, and undefined slope. They complete a puzzle matching slope-intercept and standard forms of linear equations.
Mt. San Antonio Collage
Quiz 1: Functions, Domain and Range
Take the work out of worksheets and use these problems and worked-out answer key as a resource. The problems reinforce skills in domain and range, identifying graphs, and even and odd functions.
Curated OER
Graphs of Quadratic Equations
In this math worksheet, pupils solve the problems that ask for the graph of the parabola. They interpret the quadratic equation for its solutions.
Curated OER
Chapter 10 - Objective 6.1 Graph
In this graphing worksheet, students solve linear and parabolic equations and graph equations on a coordinate plane. They use the discriminant to determine the number of x-intercepts of a parabola. This one-page worksheet contains ten...
Curated OER
Graphing Linear Equations
Ninth graders review the information that they have already learned
with regard to linear equations and graphical representations. They then assist in combining equations with a graphical element and complete various graphs with this...


