Curated OER
Graph Functions: Practice
In this graph functions activity, learners complete several activities to help them graph functions. Students use the table and the graph to complete the questions. Learners also answer two test prep questions.
Curated OER
Absolute Value And Symmetry
Young scholars engage in a lesson plan that is concerned with the concepts of absolute value and symmetry. They define the meaning of absolute value and graph functions and study the corresponding line and its symmetry. The lesson plan...
Curated OER
What Percentage of your Class is Right or Lef Handed?
Learners using their right hands, put the first letter of their last name in each square on a piece of square grid paper. Then after the 20 seconds is up, they do the same thing using their left hands.
Curated OER
Bungee M&M's
Eighth graders experiment with M&M's and a cup attached to a spring to to simulate a bungee jump. They graph the results of the experiment and make predictions for continuing the experiment. They determine the "line of best fit."
Curated OER
"Graph It"
Students work in teams to conduct short surveys of their classmates. They show their results using at least two different types of graphs.
Students separate into teams and are asked that each team to choose something that they are...
Curated OER
Unit 13: Graphs, Correlation, Line of Best Fit
Students explore the concepts of graphs, correlations, line of best fit, and the dipstick problem. In this graph, correlation, line of best fit and dipstick problem lesson, students solve problems on the above mentioned topics. ...
Curated OER
The Sine Function
Students explore the concept of the sine function. For this sine function lesson, students use a plexiglass sine wave generator to visualize the sine function. Students use a computer program/calculator to adjust aspects of the sine...
Curated OER
Fossils and Migration Patterns in Early Hominids
Students plot the locations where major fossils of hominids have been found to extrapolate possible migratory patterns.
Curated OER
MT-141 Precalculus - Worksheet 6.4(b)
In this precalculus worksheet, learners complete horizontal shift identifies. They graph functions, solve trigonometric equations using algebra, estimation and with the use of a graphing calculator. Students find the cosine of curves. ...
Curated OER
Graphing Words Word Search
In this data vocabulary worksheet, students search for 16 graph-related words in a word search grid. Each word relates to graphing and collecting data.
Curated OER
Motion
In this motion learning exercise, students determine the motion of a ball on different inclined planes, including the velocity and acceleration. This learning exercise has 8 problems to solve.
Curated OER
High School Mathematics Problems from Alaska: Reading a Graph: Azimuth Range vs. Day in Barrow, Alaska
High schoolers focus on reading and interpreting information from a graph.
Curated OER
Math 155 Worksheet 6
In this college level calculus learning exercise, students determine the derivatives of the indicated functions and solve application problems. The two page learning exercise contains seven problems. Answers are not included.
Curated OER
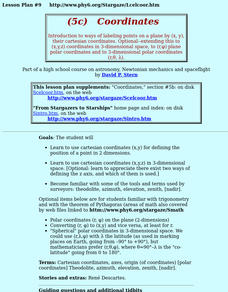
Coordinates
Young scholars use cartesian coordinates (x,y,z) in 3-dimensional space. [Optional: appreciate there exist two ways of defining the z axis, and which of them is used.] They become familiar with the tools and terms used by surveyors.
Curated OER
Great Graphs
Students create graphs by tabulating their preferences among 10 state quarters. They examine quarters and tally their favorites. They complete a worksheet. There are more lesson plans included in this unit.
Curated OER
Mapping an Artifact
Students copy a present day artifact onto graph paper. In groups, they decide the scale of the drawing and create the picture using specific graphing points. They are also given photographs in which there are no graphing points and they...
Curated OER
An Apple A Day
Students create a graph that showcases their pick for favorite kind of apple. Students are given samples of a variety of apples to determine their favorite in a taste test. They a create a tally chart of favorite kinds apples and use a...
Curated OER
Graphing
Fifth graders create graphs based on climate in South Carolina. They read and interpret information in a chart and construct a graphy from the information in the chart. They create a spreadsheet using Excel and publish 2 graphs.
Curated OER
Scientific Method for Middle Schools
Students use the scientific method to solve a teacher scenario. They bring in M&M's. Students are given a copy of the scientific method. They first come up with a problem. Students are told that they are going to conduct an...
Curated OER
Graphing: Ocean Floor
Students graph the ocean floor using given data. In this earth science lesson, students label different oceanic features on the map. They answer questions at the end of the lab.
Curated OER
Scientific Inquiry: Periodic Motion
Students construct their own pendulum. In this physics instructional activity, students design an experiment to find the factors affecting its period. They formulate a conclusion based on experimental data.
Curated OER
Investigation of Timbre
Students design an experiment to analyze the timbre of different instruments. For this physics lesson, students analyze the missing quality in sound. They discuss their results in class.


