Hi, what do you want to do?
Curated OER
Equations and Systems of Equations
Students practice using algebra to be applied to real world situational problems. The key concepts of translation of language to algebraic expressions is covered. They also look in depth at relationships between different quantities.
Curated OER
La Toteca- A Tropical Paradise
Students collect data on the time of the ferry. For this algebra lesson, students use the data to predict a ferry schedule. They also compute the depth where oxygen would be needed when diving.
Pennsylvania Department of Education
Alike and Different
Students compare and contrast objects and are introduced to a Venn Diagram. In this alike and different lesson, students make observations regarding properties of objects. Students classify object and build ideas about variables....
Curated OER
Using Representations to Model Problems
student make predictions or draw conclusions based on physical and visual representations of profit and sales. They model problems with physical materials and visual representations, and use models, graphs and tables to draw conclusions...
Curated OER
Looking For Triangles
Students solve problems with triangles. In this geometry lesson, students analyze shapes to find different triangles. They name the shapes created by putting triangles together.
Curated OER
Confusing Colors!
Fourth graders collect data, graph their data, and then make predictions based upon their findings. They's interest is maintained by the interesting way the data is collected. The data collection experiment is from the psychology work of...
Curated OER
Graphing With RXTE
Young scholars use data from the Rossi X-ray Tiiming Explorer (RXTE) satellite to analyze and graph.
Texas Instruments
Texas Instruments: Writing Linear Functions With Traffic Tickets
Students can use traffic tickets to demonstrate their understanding of writing linear functions.
Khan Academy
Khan Academy: Algebra I: Writing Linear Functions Word Problems
Find a linear function that represents a real-world relationship that is given verbally. Students receive immediate feedback and have the opportunity to try questions repeatedly, watch a video, or receive hints.
Khan Academy
Khan Academy: Writing Linear Functions Word Problems
Practice writing a linear function that represents a real-world relationship that is given verbally. Functions are written using function notation.
CK-12 Foundation
Ck 12: Algebra: Write a Function in Slope Intercept Form
[Free Registration/Login may be required to access all resource tools.] Learn to write a function in slope-intercept form
San Diego State University
San Diego State University: Examples of Writing Linear Equations
These examples show how to write linear equations from different types of information. There are even real-world examples dealing with air pressure, sea urchins, and measurement conversions.
Texas Instruments
Texas Instruments: Linear Equations and Y Intercepts
These questions measure knowledge and skills: order of operations; solving equations in one variable; graphing linear equations; writing linear expressions and equations; finding the y-intercept of a linear function.
University of Regina (Canada)
University of Regina: Math Central: Writing Linear Equations
Three different lessons demonstrate how to write linear equations. The equations found from two points, slope and a point, and slope and y-intercept are all featured. The lessons have an overview, materials, procedures, and evaluation...
University of Colorado
University of Colorado: Ph Et Interactive Simulations: Ph Et: Function Builder
Play with functions while you ponder Art History. Explore geometric transformations and transform your thinking about linear functions, then have fun figuring out the mystery functions.
CK-12 Foundation
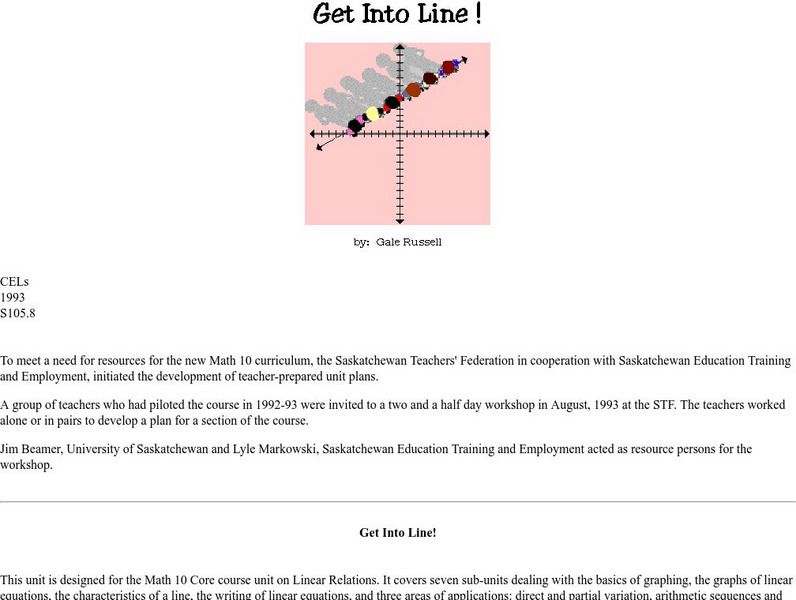
Ck 12: Algebra: Graphs of Linear Equations
[Free Registration/Login may be required to access all resource tools.] Students learn to write and graph linear equations to represent a function and analyze graphs of linear functions. Students examine guided notes, review guided...
CK-12 Foundation
Ck 12: Algebra: Graph Using Intercepts: Graphs of Linear Functions
[Free Registration/Login may be required to access all resource tools.] In this tutorial, students learn to write and evaluate functions and determine if a graph represents a function. They examine guided notes, review guided practice,...
CK-12 Foundation
Ck 12: Algebra: Using Functions to Describe a Situation
[Free Registration/Login may be required to access all resource tools.] Students learn to write a function rule from a table of values and represent real-world situations with a function. Students examine guided notes, review guided...
CK-12 Foundation
Ck 12: Algebra: Function Rules for Input Output Tables
[Free Registration/Login may be required to access all resource tools.] Students learn to write a function rule from an input-output table. Students examine guided notes, review guided practice, watch instructional videos and attempt...
Other
Technical Tutoring: Linear Functions and Straight Lines
Learn how to write equations for linear functions in all three forms: point-slope, slope-intercept, and general. Also look at equations for parallel and perpendicular. The page gives an explanation of how to obtain the point slope form...
CK-12 Foundation
Ck 12: Identifying Function Models: Linear, Exponential, and Quadratic Models
[Free Registration/Login may be required to access all resource tools.] Learn how to distinguish between linear, exponential, and quadratic models.
Texas Instruments
Texas Instruments: Linear Functions: Slope Intercept Form
Students learn to develop the equation of a line from its graph. They also learn to write the equation of a line from the slope and the y-intercept, a point and the slope, and two points. They also investigate slopes of lines that are...
Khan Academy
Khan Academy: Linear Models Word Problems
Solve general word problems about real-world relationships that can be modeled by linear equations or functions. Students receive immediate feedback and have the opportunity to try questions repeatedly, watch a video, or receive hints.
Texas Education Agency
Texas Gateway: Writing Verbal Descriptions of Functional Relationships
Given a problem situation containing a functional relationship, the student will verbally describe the functional relationship that exists.


