Illustrative Mathematics
Art Class, Assessment Variation
Play with paint and decide the ratio to make different shades of green. When mixing paint colors, your painters should decide which ratios make the same shade and what is needed to mix other ratios for a different shade of green. This is...
Illustrative Mathematics
Finding an Unknown Angle
Teach your class how to apply their knowledge of geometry as they explore the unknown. In order to find an unknown angle, students must understand that rectangles have four interior right angles, that right angles have 90 degrees, and...
Curated OER
Mixing Candies
Mixture problems are a classic in first-year algebra. Unfortunately, many learners approach them in a formulaic fashion and don't truly understand the meaning of the algebraic expressions they are using. Here, the questions are not the...
Illustrative Mathematics
How Long
It won't take young mathematicians long to learn how to measure length with this fun, hands-on activity. Working in pairs, children use Unifix® or snap cubes to measure and record the lengths of different classroom objects. To extend the...
Curated OER
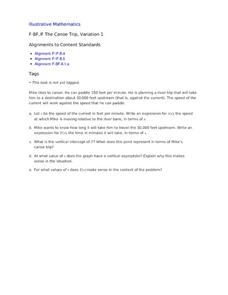
The Canoe Trip, Variation 1
Your river sportsmen will explore an example of paddling upstream as they build functions modeling speed and time in terms of the speed of the current. They then use their algebraic models to interpret features of the function related to...
Curated OER
What Functions do Two Graph Points Determine?
Your algebra learners write linear, exponential, and quadratic equations containing the same two graph points in this collaborative task.
Curated OER
US Population 1982-1988
Your algebra learners make predictions using the concepts of a linear model from real-life data given in table form. Learners analyze and discuss solutions without having to write a linear equation.
02 x 02 Worksheets
Inverse Variation
Discover an inverse variation pattern. A simple lesson plan design allows learners to explore a nonlinear pattern. Scholars analyze a distance, speed, and time relationship through tables and graphs. Eventually, they write an equation to...
Curated OER
Cartography Project
A lesson involving mapping, the use of a compass, writing and following directions, and exploring the first two themes of geography is here for you. Learners create original maps that show the routes they take through their own...
Curated OER
Race to the Top
Here is a game that will help your young mathematicians practice number recognition and writing numbers. Played with a spinner or dice, individual learners or a pair will play this fun number game. They will roll the die or spin the...
Curated OER
Wildflower Beautification Project
Students, in cooperative groups, design and create a wildflower garden for the community. They write letters to property owners requesting use of their land and then write invitations to their parents and to local, state, and federal...
Curated OER
Study Buddies: Relating Multiplication And Division
These acitivities are designed for two! With a partner, problem solve and calculate the answers to fifteen word problems or mathematical equations. Scaffolding and coaching are included, and as an extension learners are prompted to...
Alabama Learning Exchange
Time to Tell Time
Students demonstrate how to tell time using an analog clock. In this time measurement lesson, students read the book Clocks and More Clocks and use analog clocks to demonstrate the time that the teacher called out.
Curated OER
Simple Inequalities
Learners solve inequalities. In this inequalities instructional activity, students evaluate simple inequalities. They examine vocabulary words. Learners participate in breath holding activities and write inequalities to represent the...
Curated OER
Chocolate Graphing
Chocolate lovers develop a bar graph based on the types of chocolate the class likes. They participate in The Art of Chocolate at The Hershey Story before they make a bar graph that shows the favorite chocolate types of their class. They...
Curated OER
Egyptian Fractions
You don't have to be an ancient Egyptian to decipher fractions in this activity that focuses on adding fractions with unlike denominators and developing fraction number sense. Egyptians represented fractions differently than we do. They...
Curated OER
Problem Solvers
Fifth and sixth graders compare decimals to the place-value structure in the base-ten number system. They represent fractions as parts of unit wholes, as parts of a set, as locations on a number line, and as divisions of whole numbers....
Curated OER
Vacation Values: A Math WebQuest
Fifth graders participate in a Math Web Quest to research two vacation options for their "families" in order to determine the best mathematical value for their family. They gather data, create two comparison graphs based on that data,...
Curated OER
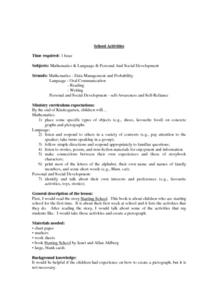
School Activities
First graders place some specific types of objects (e.g., shoes, favorite food) on concrete graphs and pictographs. They listen and respond to others in a variety of contexts (e.g., pay attention to the speaker; take turns speaking in a...
Curated OER
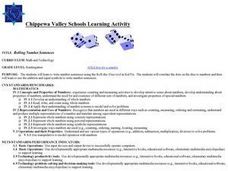
Rolling Number Sentences
Budding mathematicians investigate how to write number sentences using the Roll-the-Dice tool in "Kid Pix". They correlate the dots on the dice to numbers and then learn to use the addition and equal symbols to write number sentences....
Curated OER
Bubbles Galore
Students investigate bubbles. In this science lesson, students observe how long bubbles last and graph the results of the experiment.
Curated OER
Interactivate: Introduction to Functions
This interactive website provides a variety of lesson plans according to which standards you are applying and which textbook you use. Introduce functions to your class by having them construct single operation machines and create...
Curated OER
Statistics Canada
Students practice using graphing tools to make tables, bar charts, scatter graphs, and histograms, using census data. They apply the concept of measures of central tendency, examine the effects of outliers. They also write inferences and...
Curated OER
Interpreting Graphs
Sixth graders interpret linear and nonlinear graphs. They create graphs based on a problem set. Next, they represent quantitive relationships on a graph and write a story related to graphing.


