Curated OER
Data Analysis and Probability: Graphing Candy with Excel
Collect and graph data using Microsoft Excel with your math class. They will make predictions about the number of each colored candy in a bag of M&M's, then sort, classify, count, and record the actual data before using Excel to...
Curated OER
Adding and Subtracting Decimals With Excel
What a great way to have pupils apply classroom learning to real-world skills! They complete problems involving the addition and subtraction of decimals related to banking-type questions, and then use a spreadsheet to display their results.
Illustrative Mathematics
Writing Constraints
Use this resource to present your number crunchers with how to write a constraint equation and to determine viable solutions. The price of an object limits the amount that can be purchased. The speed at which you walk limits the number...
Curated OER
Graphing Using Excel
Fifth graders complete a series of graphs by gathering information and using Excel to graph the information. In this graphing lesson, 5th graders graph favorite desserts of the class. Student put their results into the...
Curated OER
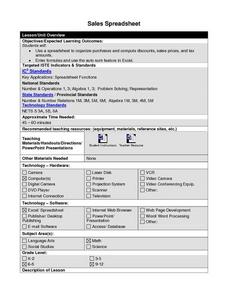
Sales Spreadsheet
Students use Excel spreadsheets to organize purchases, discounts, sales prices, and sales tax. Students follow step by step instructions and enter formulas as well as use the auto sum feature to calculate required calculations.
Curated OER
Excel Lesson Plan Coin Statistics
Second graders determine the difference between making a prediction and determining actual information. They design a spreadsheet for a coin flipping activity on which they include their predictions and what actual happens when they flip...
Curated OER
Springfield Digital Storytelling Project #6: Grapes Commercial
Here is a fabulous lesson that should have your class very excited! They utilize the GRAPES formula in order to produce a commercial like ones we see on TV. Working in pairs, they must come up with a script, take video, provide music,...
Curated OER
All About Me
Students complete various biographical and autobiographical writing activities. They write an autobiographical essay, biopoem, biographical essay, and design and decorate a bag presenting character traits.
Curated OER
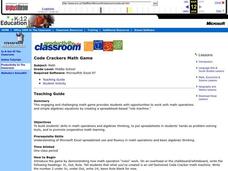
Code Crackers
Learners work in teams creating and posing math rules and trying to guess them using a formula controlled worksheet they create with Excel. Student pairs take turns to see who can crack the other's code the fastest.
Curated OER
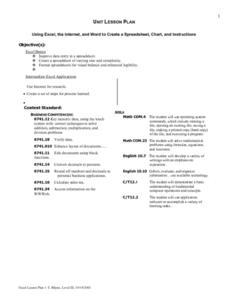
Using Excel, the Internet, And Word To Create a Spreadsheet, Chart, And Instructions
Students improve data entry in a spreadsheet.
Curated OER
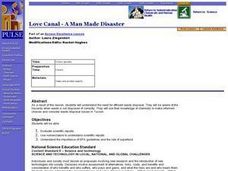
Love Canal-A Man Made Disaster
High schoolers watch a "Waste Management" Power Point as well as a "Love Canal" PowerPoint (a link is provided for the second presentation). Students write the chemical formula for each chemical and convert the contamination to grams...
Curated OER
Back-To-School Shopping
Fifth graders estimate the prices of items to be bought for back to school. They use catalogs and/or advertisements to research the cost of each of the items. They use problem solving strategies and a spreadsheet template to determine...
Discovery Education
Sonar & Echolocation
A well-designed, comprehensive, and attractive slide show supports direct instruction on how sonar and echolocation work. Contained within the slides are links to interactive websites and instructions for using apps on a mobile device to...
Curated OER
Down the Drain: How Much Water Do You Use?
Participate in an Internet-based project to share information about water usage with other students. Collect information about water usage and compare it to the average used by people in other parts of the world.
Curated OER
Frogs
Students explore the external and internal structures of an amphibian and how frog anatomy compares to human anatomy. They collect pictures of a frog using a digital camera, create a web page, develop a PowerPoint presentation, and...
Curated OER
Do Vampires Really Exist?
Pupils identify and extend a number pattern into very large values. They create and interpret a graph based on their number patterns. Students compare a math model with real-world statistics about the existence of vampires.
Curated OER
Statistical Pictures of School and Life
Students explore how mathematical data is used to summarize and illustrate everyday life. They apply mathematical concepts and skills to analyze data. Students conduct a five question survey of 50 people or more and graph the data.
Curated OER
I'm in the Money - Practical Money Skills
Students make a budget and utilize math skills to keep a record of what they spend. They use technology and spreadsheets to help them keep track of their money.
Curated OER
Don't Trash the Earth
Learners experience a hands-on environmental science project. They access about recycling as they collect data on their own family's trash production. Students analyze the data with worksheets, chart the data, and present their findings.
Curated OER
Area graphics for 7th graders
Students randomly select dimensions for three geometric shapes (square, right triangle and circle). From the graphs they compare and contrast the graphical results of each shape.


