Curated OER
Which Vegetable Do You Like To Eat the Most?-- Class Bar Graph
In this math activity, students participate in a group graphing activity. Students are surveyed on favorite vegetables and the results are plotted on a bar graph.
Curated OER
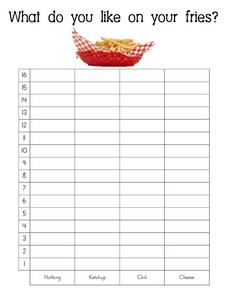
What Do You Like on Your Fries?-- Class Bar Graph
In this math worksheet, students participate in a group graphing activity. Students are surveyed about what they like on their fries: nothing, ketchup, chili or cheese. Results are plotted on a bar graph.
Curated OER
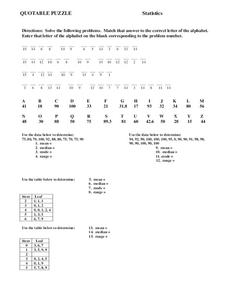
Statistics
In this statistics worksheet, 8th graders solve and complete 15 different problems. First, they solve each problem by using the data given to determine the mean, median, mode, and range for each set. Then, students match that answer to...
Curated OER
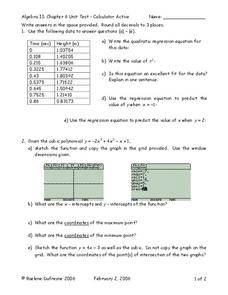
Polynomial Functions
In this Algebra II worksheet, 11th graders use a graphing calculator to determine the regression equation of the given data, graph polynomial functions, factor polynomials, and determine the quotient and remainder in polynomial division....
Curated OER
My Test Book: Mean, Median, and Mode
In this math skills worksheet, students solve 10 multiple choice math problems regarding mean, median, and mode. Students may view the correct answers.
Curated OER
Teen Pregnancy: Investigating Cubic Functions
In this teen pregnancy learning exercise, students use a scatter plot and cubic functions to solve word problems about teen pregnancy. Students complete 7 problems.
Curated OER
Statistics
In this statistics learning exercise, 9th graders solve and complete 5 different word problems that include different data. First, they determine if there is an explanatory and a response variable in the given data set. Then, students...
Curated OER
Fruit Loops/Cheerios Activity: Measures of Central Tendency
In this measures of central tendency learning exercise, students use Fruit Loops and Cheerios to gather statistical data. They find the mean, mode and median of the data. Students construct a box-and-whisker plot of the class data. ...
Curated OER
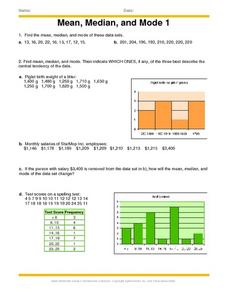
Mean, Median And Mode 1
For this mean, median and mode worksheet, students problem solve and calculate the answers to ten word problems associated with the mean, median and mode of collected data.
Curated OER
Calorimetry Lab
For this calorimetry lab, students apply the information read about a calorimeter to conduct a scientific investigation. Students record their data in a chart. Students use the information from the chart to calculate specific heat of...
Curated OER
Scatter Plots
In this scatter plots learning exercise, students solve and complete 4 different problems. First, they use the table shown to model the relation with a scatter plot and trend line and to predict the value of a variable when given the...
Mrs. Glosser's Math Goodies
Number Theory Worksheet 3
A nine-row data table has novice number crunchers fill in columns for the greatest common factor, least common multiple, product of the two, and product of numbers. The pairs of numbers to work with are all single- and double-digit...
Curated OER
Estimate Sums and Differences
For this estimating sums and differences practice worksheet, students sharpen their problem solving skills as they solve 6 story problem.
Curated OER
City Skylines Quiz
In this online interactive geography quiz learning exercise, students respond to 15 identification questions about the pictured city skylines. Students have 4 minutes to complete the quiz.
Curated OER
Air Pollution: What's the Solution?
In this pollution worksheet students study how wind affects air pollution. Students answer questions on wind data and calculate miles per hour.
Curated OER
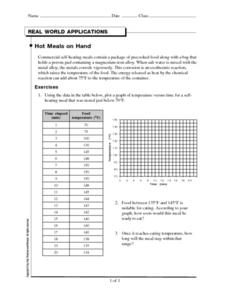
Hot Meals on Hand
In this exothermic reactions worksheet, students read about how commercial hot meals are heated through the use of exothermic reactions. They graph data of temperature and time elapsed for hot meals and answer two questions about the graph.
Curated OER
Market Share
In this business worksheet, students find the correct terms to complete each thought needed for the statement to be true from the word bank that is provided.
Curated OER
Functions As Graphs Worksheet
In this math worksheet, high schoolers graph the data given in the organizer. The functions are used to create the new line for finding the possible unknowns.
Curated OER
How Many of Each Coin Do We Have in Our Bag?-- Class Bar Graph
In this math worksheet, students participate in a group project to record the kind of coins they pick at random from a bag. Students record the data on this classroom bar graph.
Curated OER
Weather Prediction
In this weather worksheet, students review vocabulary words and concepts associated with predicting the weather. Students understand what a meteorologist studies. This worksheet has 7 matching, 10 fill in the blank, and 5 short answer...
Curated OER
Middle Most Numbers and Division
For this middle most numbers worksheet, students examine a set of given data. They place the numbers in order from least to greatest and identify the mean of the set. This one-page worksheet contains six division problems.
Curated OER
Hands On: Model Finding the Mean
In this data worksheet, 5th graders use counters to model finding the mean in 6 word problems. They work with 6 sets of numbers which include fractions.
Curated OER
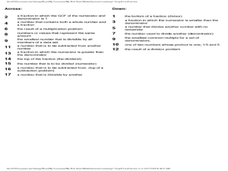
Computations with Fractions Vocabulary Crossword
In this fractions crossword, students fill in the blanks to the crossword with vocabulary words representing the computations of fractions. Students complete 17 spaces in the crossword.
Curated OER
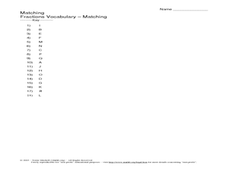
Matching Fractions Vocabulary
In this matching fractions vocabulary activity, 6th graders match eighteen words about fractions in one column with definitions in the other column.

