Curated OER
Tell Us All: Tools for Integrating Math and Engineering
What a scam! Middle and high schoolers pose as journalists exposing consumer fraud. In this lesson, they write an article for a magazine using data collected during previous investigations (prior lessons) to defend their findings that a...
Curriculum Corner
Academic Reading Vocabulary
From A to Z, learners define, draw, and find examples of specific reading focus skills in an alphabetized reading vocabulary packet. Words include dialogue, theme, text structure, genre, paraphrase, and many more.
American Statistical Association
Don't Spill the Beans!
Become a bean counter. Pupils use a fun activity to design and execute an experiment to determine whether they can grab more beans with their dominant hand or non-dominant hand. They use the class data to create scatter plots and then...
American Statistical Association
Colors Challenge!
Does writing the name of a color in a different colored ink affect one's ability to read it? Scholars design an experiment to answer this question. They collect the data, analyze the statistics, and draw a conclusion based on...
Howard Hughes Medical Institute
Lactase Persistence: Evidence for Selection
What's the link between lactase persistence and dairy farming? Biology scholars analyze data to find evidence of the connection, then relate this to human adaptation. Working individually and in small groups, learners view short video...
Yummy Math
Should NFL Quarterbacks Shave or Grow a Beard?
What does facial hair have to do with quarterback ratings? Using a set of data that provides QBR with and without facial hair, football enthusiasts determine if performance is affected. It also has learners question if the relationship...
Statistics Education Web
Did I Trap the Median?
One of the key questions in statistics is whether the results are good enough. Use an activity to help pupils understand the importance of sample size and the effect it has on variability. Groups collect their own sample data and compare...
EngageNY
Grade 12 ELA Module 4: Literary Analysis
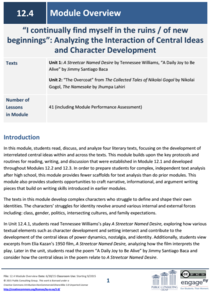
Does identity come from within, or do external forces shape it? Explore the complex identity concept with a two-unit module for 12th-grade language arts. The first unit uses A Streetcar Named Desire by Tennessee Williams and "A Daily Joy...
Curated OER
Creating Children's Books
Students collaborate to create a children's book. In this visual arts activity, student study the components and procedures that go into making a children's book including the shape, size. layout, biographical information about the...
BW Walch
Solving Linear Inequalities in Two Variables
Although graphing a linear inequality on the plane is but a few steps added onto the graphing of a linear equation, for many learners the logical leap is quite intimidating. This approachable PowerPoint presentation breaks graphing...
Literacy Design Collaborative
Rhetorical Analysis for Pre-AP English
Scholars closely analyze the use of rhetorical strategies in several model texts. They work in groups to annotate the text identifying rhetorical elements, and to complete a Rhetorical Analysis chart and guided reading worksheet....
Curated OER
Handling Data
Learners create a simple table in order to solve a problem. As a class, they create a simple data table in order to discover the number of letters in each student's name. This data is interpreted in order to answer questions and make...
Curated OER
A Picture is Worth a Thousand Words: How to Analyze a Historic Photograph
Students analyze historical images. In this primary source analysis instructional activity, students examine an photograph of Hershey, PA from the 1920's. Students collaborate with one another and their instructor to note the details in...
Curated OER
Using Data to Determine the Location of the Stiffest Opposition to School Desegregation in the 1970's
Students analyze historical data. In this school desegregation lesson, students make predictions about opposition to desegregation, examine the provided desegregation data, and determine if their predictions were correct.
Curated OER
Worksheet for Analysis of a Poster
In this primary source analysis worksheet, students respond to 25 short answer questions that require them to analyze the provided poster from the Tennessee State Library and Archives.
Curated OER
Data! Data! Graph that Data!
Fifth graders create data graphs using Microsoft Excel. In this data collection lesson, 5th graders create and conduct a survey, then use Excel to organize and graph their data.
Curated OER
Comparing Data on Graph A and Graph B
Second graders gather and graph data. In this graphing lesson, 2nd graders collect data and graph this information using tally charts, bar graphs, pictographs, or tables. They make predictions about the outcomes.
Curated OER
Language Arts, Word Choice
Third graders practice replacing words in a sentence to make it more interesting. In this word choice lesson, 3rd graders listen to the story The Hard-Times Jar by Ethel Smothers and discuss the author's word choice. Students then...
Curated OER
Tables & Data
In this subtraction worksheet, 4th graders problem solve 8 sentence subtraction word problems involving different types of birds. Students write their answers on the lines provided.
Curated OER
Data Scavenger Hunt
Eighth graders discuss how data is collected and participate in data collection through a survey. They complete a scavenger hunt on the Internet to gain understanding of the data measures mean, median, mode, and range.
Curated OER
Interpreting Data and Building Hypothesis
Students define the term species, and graph species data together with previously collected data at the National Zoo. They interpret graphed data and recognize patterns in the streamside quadrant versus hillside quadrant. Students use...
Curated OER
Data Analysis: Infiltration Rate and Composition of Concrete
Students collect and graph data. In this statistics lesson, students analyze data using a spreadsheet program. They display their data effectively and analyze it.
Curated OER
Worksheet for Analysis of a Photograph
For this primary source analysis worksheet, students respond to 25 short answer questions that require them to analyze a photograph from the Tennessee State Archives.
Curated OER
No Regrets: a Poetry Analysis
Students read a poem and use the TPCASTT strategy for analysis. In this poetry analysis activity, students journal about their future goals and read John Updike's "Ex-Basketball Player." Students discuss the purpose of the poem and...
Other popular searches
- Word Analysis and Decoding
- Word Analysis Strategies
- Word Analysis Skills
- 500 Word Character Sketch
- Vocabulary Word Analysis
- Powerpoint Word Analysis
- Word Analysis 1.5
- Ell Reading Word Analysis
- Vocabulary, Word Analysis
- Word Analysis 15
- Ell+reading Word Analysis
- Word Analysis Worksheets


