Curated OER
Death by Particles
Emerging epidemiologists define relative risk and read an article about the effect of particulate pollution on the cardiovascular health of women. They record the relative risk values, graph them, and answer analysis questions. This is a...
Alcohol Education Trust
Talk About Alcohol: What is BAC (Blood Alcohol Concentration)?
Educate your class about blood alcohol levels by combining health with math practice. Class members read a little bit about blood alcohol concentration and then solve some problems related to determining alcohol levels and alcohol...
Curated OER
Closing the Salary Gap
Students explore careers in their community and compare the average salaries for men and women working in those careers. They explore a variety of careers available in their community through participating in this lesson.
Curated OER
What's in a Number? Analyzing Smoking Statistics
Sixth and seventh graders analyze smoking statistics. In this health lesson plan, learners look at the percentage of people who smoke from each race group. They create a bar graph and circle graph that displays this information.
Curated OER
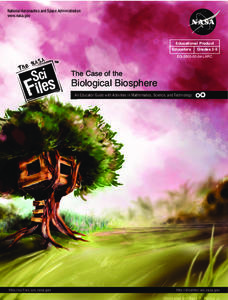
The Case of the Biological Biosphere: Health, Math, Technology
Students investigate various aspects of the human body in this imaginative Tree House Detective episode about the biological biosphere. In a series of They take measurements, analyze data, and use technology. The lessons revolve around...
Curated OER
Border Math
Learners examine and interpret data relating to U.S.-Mexico borderland realities, and consider such aspects of social science as the study of population, crime, government spending, pollution, health, and economics.
Curated OER
Data Collection
Students investigate qualitative and quantitative data. In this statistics lesson, students gather data on heights and weights of people and graph the distribution. Students discuss the differences between qualitative and quantitative data.
Curated OER
Suicides And Suicide Rates
Students investigate suicide using a variety of criteria and create a bar graph before discussing the results as a class.
Curated OER
Business 90 Midterm 2: Probability
In this probability worksheet, students examine given business situations and determine the probability of an event. They create tree diagrams and contingency tables. This nine-page worksheet contains 7 multi-step problems.
Curated OER
I Have A Friend Who
In this friend worksheet, students use logic and reasoning to determine the characteristics of a person. This one-page worksheet contains 1 problem. The answer is provided.
Other popular searches
- Womens Health Pregnancy
- Womens Health and Nutrition
- Womens Health "Pregnancy
- Womens Health Breast Cancer
- Womens Health Worksheets
- Womens Health "Pregnancy"
- Women's Health Pregnancy
- Women's Health and Nutrition
- Women's Health Breast Cancer
- Women's Health Worksheets
- Women's Health "Pregnancy
- Women's Health Literacy


