Curated OER
Climate Systems - Which Location Is Best For Me?
Young scholars study the difference between weather and climate. In this climate systems lesson students search the Internet for the parts of the Earth's system, gather climate data and complete a challenge scenario.
Curated OER
Running on Metrics
Young scholars use the metric system to convert equations. They use a conversion table to change from metric units to the units they are more comfortable with (Fahrenheit temperatures, miles, quarts, pounds.) Students use algebraic...
Curated OER
How Wet Did It Get?
Students measure the rainfall/snowfall on the playground on a rainy/snowy day with a rain/snow gauge. They draw a bar graph representing the amount of water that fell and observe a satellite image of the clouds and local weather system...
Pleasanton Unified School District
Temperature Review Worksheet
Young scientists examine how temperature is measured in both Fahrenheit and Celsius in a box in a weather science worksheet. They write equivalent temperatures in four examples and write the temperatures shown on four thermometers at the...
Curated OER
Nature of Science and Measurement Review
In this nature of science and measurement worksheet, students answer 30 questions about experimental design, pure science vs. applied science, density, metric conversions and dimensional analysis.
Curated OER
Activities to Enhance STEDII Data
Students develop an understanding of related weather processes such as wind, cloud cover, and temperature using STEDII data and instrumentation. In addition, they integrate mathematical calculations to produce a forecast map.
Curated OER
Understanding Celsius
Student read both Celsius and Fahrenheit temperatures on thermometers. They covert the temperatures and write poems to show understanding.
Curated OER
Wave Math
Students identify the different factors affecting the size and shape of ocean waves. In this math lesson, students calculate wave speed and wavelength given a mathematical formula.
Curated OER
Alliance to Save Energy's Green Schools Program
First graders, in groups, discover which colors absorb heat and which colors best reflect heat. They do this using the scientific method.
Curated OER
Clifford Learns About the Four Seasons and So Do We!
Students explore the seasons and months of the year through literature, math, art and movement. They identify the month of their birthday and in which season it comes. Students name the four seasons and they memorize a poem to recite the...
Curated OER
Multiplying With Nine As A Factor
Elementary math minds complete various activities to memorize the multiples of nine. They watch a PowerPoint presentation and demonstrate the finger trick. Unfortunately the link to the multiplication activities does not take you...
Curated OER
Time/Elapsed Time
Young mathematicians complete various activities to demonstrate proficiency in telling time and identifying elapsed time. They analyze and discuss television schedules, create a booklet about their daily activities, produce a TV. guide,...
Yummy Math
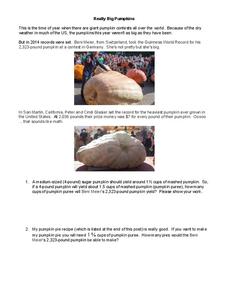
Really Big Pumpkins
You may think your holiday pumpkins weigh a ton, but in a giant pumpkin contest, they actually do! Middle schoolers read about the winners of the 2014 giant pumpkin contests before solving three word problems involving multiplication and...
Curated OER
Web Adventure -- Oakland to Chicago Flight
Students develop an awareness of mathematics in a diverse number of careers, then describe three duties of a pilot that require mathematical skills. They increase understanding of interpreting data relationships presented in table format.
Curated OER
Range, Mean, Median, and Mode
Eighth graders find the range, median, mean, and mode of a data set. For this finding the range, median, mean, and mode of a data set lesson, 8th graders collect data about the high and low temperature for 10 different cities. Students...
Curated OER
Use Temperature
In this temperatures worksheet, students read 7 clues and use their answers to fill in the temperature chart. All problems pertain to the rise and fall of temperatures in five cities.
Curated OER
The Cube and Coin Challenges
Second graders participate in several games based on colored cubes and coins. They try to figure out the relative rate at which things happen and assess the concept of playing a fair game with their peers. Each student compare familiar...
Curated OER
Temperature in a Cultural Context
Fourth graders investigate the effects of temperature on Native American lifestyle and culture. In small groups they conduct research on cultural practices showing a connection to the climate and create a poster displaying their...
Curated OER
Temperature High and Lows
Students gather high and low temperature readings through email. In this temperature graphing instructional activity, students use a spreadsheet to input data for a graph. students interpret the graphs to compare and contrast the data...
Curated OER
How Probable is It?
Students explore probability. In this probability lesson plan, students look at videos and websites where they discover probability facts that can be used in situations. They determine the probability of different events.
Curated OER
State Facts A Right Angle Puzzle
In this geometry worksheet, students create words making a right angles each time. There are 50 questions to be solved with an answer key.
Curated OER
Scatter Plots
Seventh graders investigate how to make and set up a scatter plot. In this statistics lesson, 7th graders collect data and plot it. They analyze their data and discuss their results.
Curated OER
Subtract Positive and Negative Integers
Review the concept of subtracting positive and negative integers. Learners review the rules for subtracting integers, use manipulatives to visualize the process, and complete an assessment.
Curated OER
Celsius Tells Temperature, Too
Second graders become aware that thermometer liquids expand or contract as temperature affects them.
Other popular searches
- Kindergarten Weather Unit
- Second Grade Weather Unit
- Weather Unit Plan Clouds
- Fourth Grade Weather Unit
- Weather Unit Plans
- Severe Weather Unit
- Winter Weather Unit
- Geography Weather Unit
- Weather Unit Outlines
- Weather Unit Math
- First Grade Weather Units
- Local Weather Unit


