NASA
Nasa Earth Observatory: Global Maps: Land Surface Temperature
View a global map from NASA's Earth Observatory that shows land surface temperature from February 2000 to November 2008. Learn how land surface temperature is measured and monitored.
National Weather Service
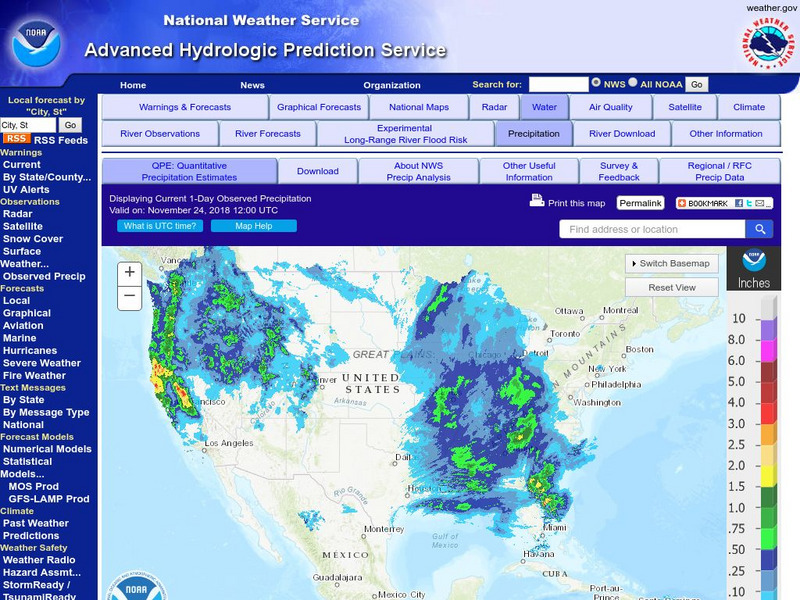
National Weather Service: Precipitation Analysis
This interactive map of the US is color coded to show the quantity of rain received throughout the country. Selections can be made to focus on certain areas and certain time frames.
Other
Weather Underground: The Authority in Expert Weather
Weather maps, forecasts, radar, NEXRAD, satellite images, and lifestyle weather reports for the United States and world. Includes Dr. Dewpoint and Weather 101 sections for educational use.
NOAA
Noaa: National Weather Service: Weather Prediction Center
Ongoing information updates on weather conditions and forecasts in the United States, displayed on animated maps.
Other
The Weather Company: The Weather Underground
Source of weather maps, forecasts, images, and data for the world. Maps include temperature, radar, visibility, wind, heat index, wind chill, humidity, and dew point.
BBC
Bbc: Weather: Search
Find information about current weather conditions anywhere in the world by entering the city and country. The site breaks down the information into specific areas and regions, which makes it convenient to search through.
Other
California Regional Weather Server: Jet Stream Analyses and Forecasts
California Regional Weather Service provides the latest jet stream analyses and forecasts for the Northern Hemisphere, Eastern Pacific & Western North America, North America, North Atlantic, and the Southern Hemisphere.
Other
Accu weather.com: Precipitation Maps
A comprehensive site of precipitation maps for the entire U.S., regions of the U.S., individual states, and areas around the world. Includes maps showing predicted precipitation, actual precipitation, and accumulated precipitation. It...
National Weather Service
National Weather Service:climate Prediction Center: Daily Precipitation Analysis
Find real-time daily precipitation analysis for the United States, Mexico, and South America as well as accumulated precipitation maps for the past 30 or 90 days.
The Washington Post
Washington Post: Mapping America's Wicked Weather and Deadly Disasters
Features data collection for natural disasters and maps the trends giving us an idea of where disasters have a tendency to strike.
NOAA
Noaa: Cpc: Hazards Assessment Brief
This Hazards Assessment from the Climate Prediction Center is intended to provide emergency managers, planners, forecasters and the public advance notice of potential hazards related to climate, weather and hydrological events. Check out...
Other
Weather Pages: Thunderstorm Map
This site contains a map of the Average Annual Days of Thunderstorms in the US. Cities are ranked in a table according to their average annual thunderstorm. Look for your city!
Other
Athropolis: Map of the Arctic
This is a useful map for orienting students to where the Canadian Arctic lies in relation to other Arctic countries. The centre of the map is the North Pole. Clicking on the map brings up weather reports for various locations.
NOAA
Noaa: Earth System Research Laboratory: Psd: Interactive Climate Map of u.s.
Investigate climate trends across the United States by clicking on individual states and then specific cities. Data is presented from 1961-1990.
Other
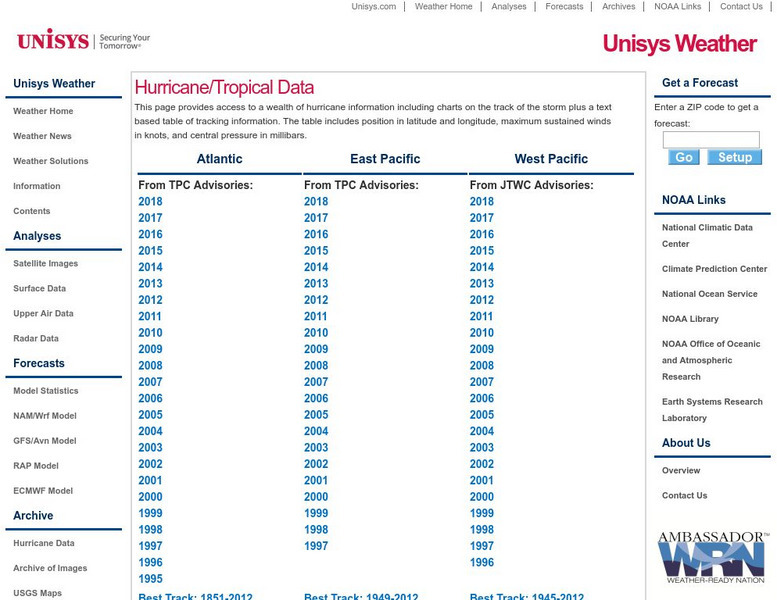
Unisys: Hurricanes/tropical Data
There is a table that has links to hurricanes in the Atlantic from 1995, East Pacific from 1997, West Pacific from 1996, South Pacific from 2000, and South India from 2000. This page has a satellite map and the Saffir-Simpson Scale.
Other
Intellicast: Daily Parcipitation in the United States
This page has a map of the United States with a key for precipitation. The key tells you the estimated precipitation for previous day.
Curated OER
Forecast Map
The National Weather Service presents this site on synoptic meteorology, large-scale weather systems. Learn about the structure and behavior of the atmosphere, including clouds, precipitation, winds and more. Also includes learning...
Other
Smis: Daily Satellite Photo: European Russia, Western Siberia, North East Europe
This site offers weather maps for three areas: European Russia, Western Siberia, and Northeast Europe. The maps show very current weather conditions for each area.
Other
Rita and Katrina: How Hurricanes Compare [Pdf]
Interesting map with information comparing Hurricanes Rita and Katrina.
Curated OER
Educational Technology Clearinghouse: Maps Etc: Land Regions of Africa, 1920
A color relief map of the African continent showing regional vegetation and terrain including lands below sea level, grasslands, temperate and tropical forests, oases, semideserts, and deserts and barren mountain slopes. The map also...
Curated OER
Etc: Maps Etc: United States and Neighboring Lands, 1920
A map from 1920 of southern Canada, the United States, and northern Mexico showing terrain features, lakes and river systems, and general vegetation types of the region. The map is keyed to show the submerged portion of the continental...
Curated OER
Educational Technology Clearinghouse: Maps Etc: Flood Stations, 1916
A map from 1916 of the United States showing the cities where the government maintained flood stations at the time. "Reservoirs to hold back flood waters have been proposed, but their construction would be very expensive. The Weather...
Curated OER
Athropolis: Map of the Arctic
This is a useful map for orienting students to where the Canadian Arctic lies in relation to other Arctic countries. The centre of the map is the North Pole. Clicking on the map brings up weather reports for various locations.
Curated OER
Map of French Guiana
The BBC presents an overview of facts on the South American region of French Guiana. Discusses its leaders, the media, and has a link to the weather there.
Other popular searches
- Reading Weather Maps
- Interpreting Weather Maps
- Interpret Weather Maps
- Surface Weather Maps
- Creating Weather Maps
- Weather Maps With Fronts
- Pressure and Weather Maps
- Analyzing Weather Maps
- Construct Weather Maps
- Winds and Weather Maps
- Interactive Weather Maps
- Just Interpret Weather Maps


