Illustrative Mathematics
Weather Graph Data
Teaching young mathematicians about collecting and analyzing data allows for a variety of fun and engaging activities. Here, children observe the weather every day for a month, recording their observations in the form of a bar graph....
Association of American Geographers
Project GeoSTART
Investigate the fascinating, yet terrifying phenomenon of hurricanes from the safety of your classroom using this earth science unit. Focusing on developing young scientists' spacial thinking skills, these lessons engage...
Curated OER
Student News And Weather Channel
Fabulous! Your 5th graders should love this project. As an ongoing lesson throughout the year students use temperature probes to record outside temperature and then document their data using spreadsheets. They use their weather data and...
Chicago Botanic Garden
Plant Phenology Data Analysis
Beginning in 1851, Thoreau recorded the dates of the first spring blooms in Concord, and this data is helping scientists analyze climate change! The culminating instructional activity in the series of four has pupils graph and analyze...
NASA
Erosion and Landslides
A professional-quality PowerPoint, which includes links to footage of actual landslides in action, opens this moving lesson. Viewers learn what conditions lead to erosion and land giving way. They simulate landslides with a variety of...
National Wildlife Federation
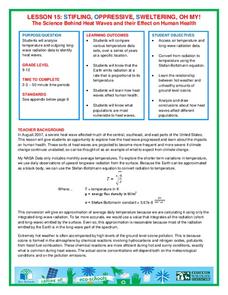
Stifling, Oppressive, Sweltering, Oh My!
Looking for a hot date? Pick any day in August, statistically the hottest month in the United States. The 15th lesson plan in the series of 21 instructs pupils to investigate the August 2007 heat wave through NASA data, daily temperature...
Curated OER
Weather Reporter
Fourth graders generate an oral presentation on the weather. In this weather lesson, 4th graders watch the weather for a week and record the data on a chart. Students give a weather report at the end of the week.
Discover Earth
Weather Stations
Transform your classroom into a fully functioning weather station with this series of hands-on investigations. Covering the topics of temperature, precipitation, wind patterns, and cloud formation, these activities engage young...
National Wildlife Federation
When It Rains It Pours More Drought and More Heavy Rainfall
Which is worse — drought or flooding? Neither is helpful to the environment, and both are increasing due to climate change. The 16th lesson plan in a series of 21 covers the average precipitation trends for two different climates within...
Curated OER
2nd Grade - Act. 28: Calendar & Weather Book
Second graders will track the weather patterns throughout the school year. This project spans the school year and takes five minutes per day or less. Measuring, data collection, and predictions are all explored throughout this relevant...
Curated OER
Weather Lesson
Students discuss the weather conditions. They read thermometer, rain gauge, barometer, and wind direction and speed. They record observations of weather conditions and enter information into data base on the computer.
Polar Trec
Beacon Valley Weather
In Beacon Valley, katabatic winds regularly knock fit adults to the ground. The lesson compares the actual temperatures to the wind chill after factoring in katabatic winds in Beacon Valley. Scholars learn to calculate wind chill and...
National Park Service
Climate Science in Focus: A Streamflow River Study
Data speaks, but it's our job to determine what it's trying to say. Young scientists explore the changes in weather and climate using data from the Yosemite National Park in a six-day unit. Learners first compare weather and climate and...
Curated OER
Creating Weather Journals
Students create weather journals. In this weather science lesson, students use digital cameras to record the daily weather and write a paragraph in a weather journal.
Curated OER
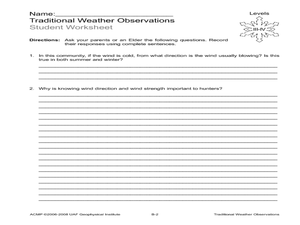
Traditional Weather Observations
Students explore traditional methods of weather observation. In this weather lesson, students interview grown-ups regarding wind. Students learn how winds can help forecast weather.
Curated OER
Trends of Snow Cover and Temperature in Alaska
Students gather historical snow cover and temperature data from the MY NASA DATA Web site. They compare this data to data gathered using ground measurements from the ALISON Web site for Shageluk Lake. They graph both sets of data and...
Curated OER
Differences between Climate and Weather
Students collect weather data over weeks, graph temperature data and compare the temperature data collected with averaged climate data where they live.
Curated OER
"Weather Watch"
Students investigate components of weather and the climate in areas around the country. They analyze data from the University of Michigan weather website, complete a weather watch worksheet, and graph weather data.
Curated OER
Bluebirds Project
In this bluebirds project worksheet, students are given directions on completing a project about bluebirds including measurements, scientific method questions, data entry, and more. Students complete 15 exercises.
Curated OER
Watch the Sky: Observing Clouds and Patterns
Students observe clouds outside of the classroom. In this weather lesson, students investigate and record the clouds above their classroom everyday for three weeks. The students then analyze their data and discuss what causes specific...
Kid Zone
Groundhog's Day Graphing
This Groundhog's Day, challenge scholars to predict, estimate, tally, and graph in a weather-themed lesson in which class members play the role of the groundhog to forecast the weather come February second.
Curated OER
Technology Integration Project Weather Unit Plan
Students use a variety of technology-assisted weather observation tools to observe and record local weather. They identify, measure and record weather conditions, summarize types of clouds and make graphs of their observations. Students...
Curated OER
Investigation 7 - Interpreting Weather Data
Fourth graders interpret the weather data they gathered in Investigation 6. They take an average of each component in each season. They compare the same components of each season and write the differences they see between the seasons.
Kenan Fellows
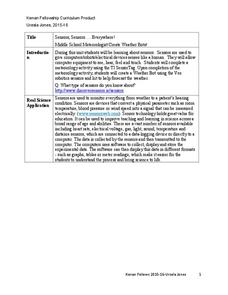
Sensors, Sensors…..Everywhere! Middle School Meteorologist Create Weather Bots!
My forecast is that you'll want to use the resource. Pupils design and create a weather bot as part of a project-based unit. These bots should be able to measure temperature, humidity, barometric pressure, wind speed and direction, and...


