Curated OER
Volcano Spreadsheet and Graph
Fourth graders use data from volcanoes to organize a spreadsheet and make a graph.
Curated OER
Mean Meadian and Mode
Students apply central tendencies to given data. In this statistics lesson, students calculate the mean, median, and mode as it relates to their data. They collect data and graph it while identifying the way the numbers are ordered.
Annenberg Foundation
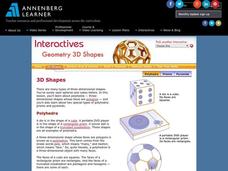
Geometry 3D Shapes: 3D Shapes
Explore vocabulary related to three-dimensional shapes. An instructional website describes the characteristics of different geometric solids. Learners can use an interactive component to view nets, faces, vertices, and edges of common...
Curated OER
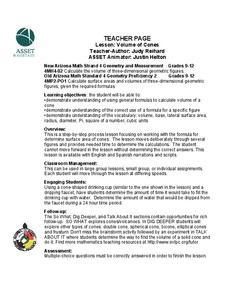
Volume of Cones
Students identify the volume of cones and pyramids. In this geometry lesson, students derive the formula for cones and pyramids. They calculate the volume of cones and other three dimensional shapes.
Curated OER
Pollution Search
First graders identify forms of pollution and describe effects that various pollutants can have on people, wildlife, and plants; students describe relationships between various forms of pollution and human actions.
Curated OER
Weathering Landforms
Fifth graders brainstorm a list of ways the Earth's surface can change. As a class, they are introduced to the concepts of erosion and weathering and discover how wind and water cause changes to the surface of the Earth. To end the...
Curated OER
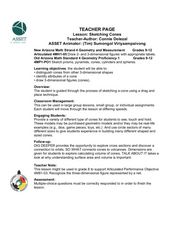
Sketching Cones
Young scholars sketch cones and identify its properties. In this geometry lesson, students calculate the surface area and volume of each three dimensional shape. they define and sketch prisms, pyramids and cylinders.


