Curated OER
Projectile Motion
A unique and useful presentation, this covers projectile motion for your general physics class. Many graphs display the vectors involved, and some even act as animations. Motion is broken down into its components and only then are the...
Urbana School District
Projectile and Circular Motion, Torque
Introduce your young scholars to the concepts of circular motion, projectile motion, angular speed, simple harmonic motion, torque, center of mass, centripetal force, and Hooke's Law with a 86-slide presentation. The circular motion...
EngageNY
Graphs of Quadratic Functions
How high is too high for a belly flop? Learners analyze data to model the world record belly flop using a quadratic equation. They create a graph and analyze the key features and apply them to the context of the video.
Virginia Department of Education
Transformational Graphing
Find relationships between the structure of a function and its graph. An engaging lesson explores seven parent functions and their graphs. Learners match functions to their graphs and describe transformations.
Curated OER
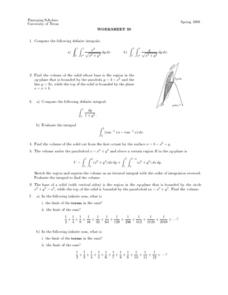
Worksheet 30 - Definite Integrals
In this integral worksheet, students find the volume of solids, compute definite integrals, and identify the limit of the terms. This one-page worksheet contains 7 multi-step problems.
Curated OER
Applications of Quadratic Functions
In this math learning exercise, students investigate the quadratic functions. They solve the word problems while writing the new algebra expressions.
Curated OER
Graphing Square Root and Other Radical Functions
In this worksheet, students graph the square root and other radical functions by examining the parent function and the translations and shifts that occur within the function family. The two page worksheet contains twelve problems.
Curated OER
Quadratics: Polynomial Form
Pupils determine how to use the polynomial form of a quadratic equation to find the location of the vertex on a graph. They determine how changes in the coefficients in a quadratic function affect its vertex on a graph. Students find...
Curated OER
Quadratic Equations and Binomial Square Theorem
Students factor quadratic equations. In this algebra lesson, students apply the binomial square theorem to solve quadratics. They complete the square and use the complex number system to solve for the roots.
Purple Math
Purplemath: Conics: Parabolas: Introduction
This reference material introduces the terms and equations related to parabolas in the context of conics. Also, relates concepts to previously-learned material and shows how to 'read' from the 'conics' form of the parabola equation.
Texas Instruments
Texas Instruments: Prehistoric Parabola Match
This activity center is used as a formative assessment after a full unit on the different transformations of vertical parabolas.
Math Words
Math words.com: Parabola
The definition for what a parabola is and an explanation of the difference between a parabola and u-shaped curve is given. Also provides illustrations of what a vertical and horizontal parabola look like.
Analyze Math
Analyze Math: Vertex and Intercepts Parabola Problems
The tutorial explores the vertex and intercepts of parabolas. Some topics discussed are vertex form, vertical axis, intercepts, and graphing. The activity consists of examples with detailed solutions.
Other
Georgia Perimeter College: Parabolas
This resource provides an examination of parabolas, both vertical and horizontal, and parabolic functions. It includes six examples and a chart showing how changes in the equation coincide with changes in the graph.


